
Two months ago I wrote a blog post documenting my first OSBSS build of our low power (long battery life) air temperature and relative humidity data logger. At that time we were using the SHT15 sensor breakout board to measure both temperature and relative humidity. After some co-location tests with Onset HOBO data loggers and others, we discovered that (a) yes we could achieve low power draw and long battery life on this base framework of a data logger, (b) yes we could achieve accurate relative humidity readings compared to a HOBO, but (c) unfortunately, our temperature readings were not very accurate (they were decent after calibration, but who wants to build a temperature sensor that then has to be calibrated against another, better temperature sensor!?). This last part really bugged us — we simply couldn’t rely on the SHT15 to provide accurate temperature measurements, which then, because RH is based on temperature readings, yielded both inaccurate T and RH readings.
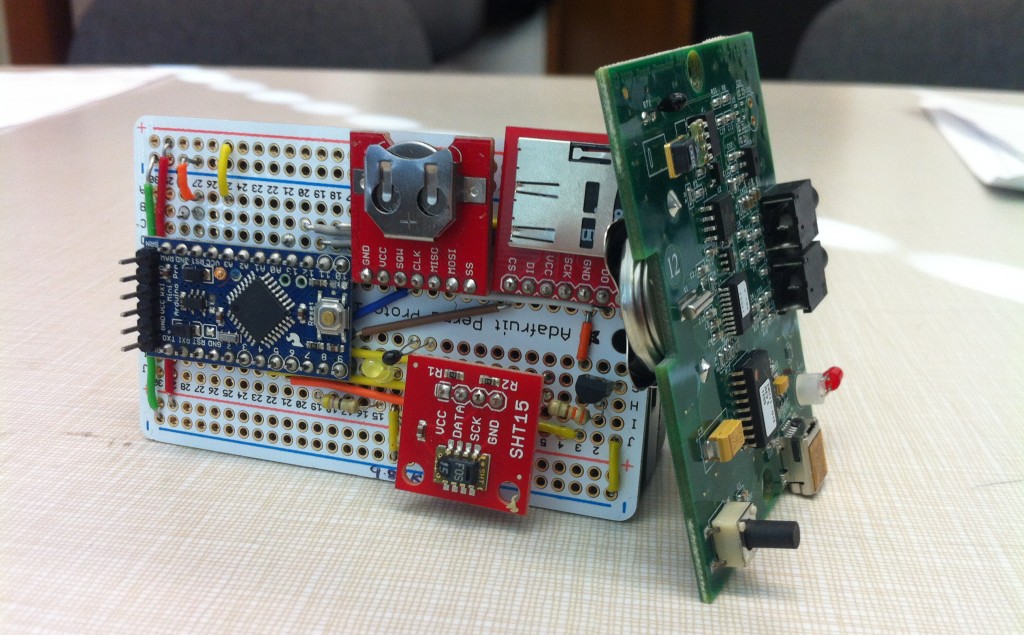
So we went back to the drawing board on our temperature readings. We experimented with a number of inexpensive thermistors, adjusting the ways with which we dealt with temperature readings from resistance readings, and adjusting the ways we handled resistors. After a bunch of co-location tests, we realized we couldn’t get away with using cheap thermistors. So we took another step up to US Sensor’s ‘ultra precision’ thermistors with 0.05 degC accuracy. They’re more expensive for sure, but we’re only talking 6 or 8 bucks depending on how many you order. They soon arrived and Akram worked on integrating them within our base logger framework. Akram then took my original OSBSS T/RH (v 0.01) build and added one of these thermistors (after they showed promise during preliminary co-location tests). He gave the logger back to me within a matter of minutes, and I launched the 09 30 2014 revision of our T/RH logger alongside an Onset HOBO U12 in my office and let them go. Here’s the resulting data:
First, I kept the OSBSS data logger unenclosed and the HOBO remained in its enclosure. After about 24 hours of co-location, here’s what we ended up with:
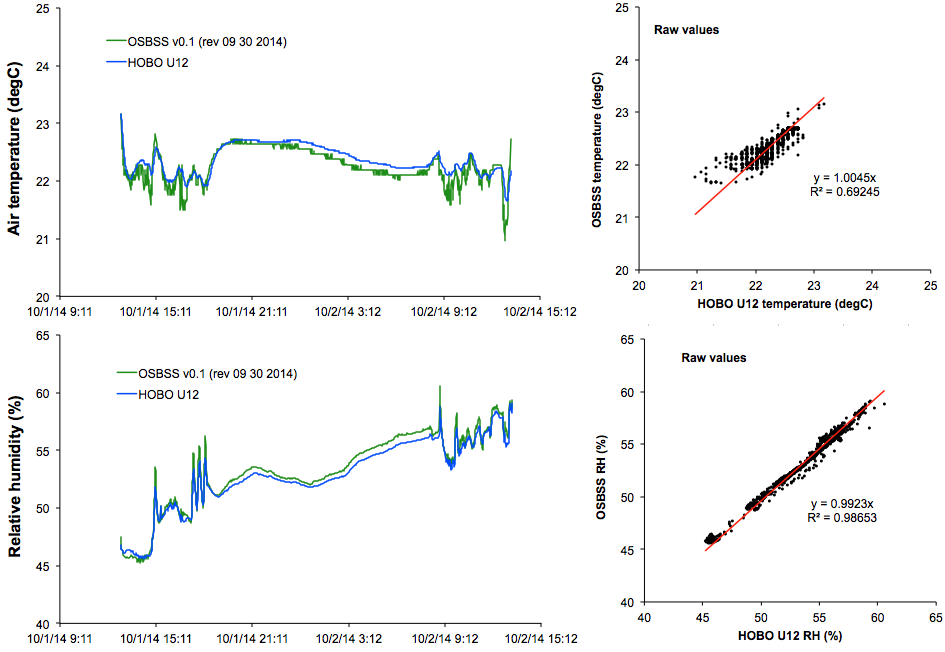
Overall, I was very happy to see the consistent slopes between OSBSS and HOBO of about 1.0 for both T and RH, but there was some scatter in the temperature data that left me a little uneasy. Looking at the time series temperature data, you can see there is often a bit of an offset and the HOBO tended not to fluctuate as much in the peaks and valleys as the HOBO. Perhaps this was only due to the plastic enclosure on the HOBO providing some thermal mass that dampens the values? To check this, I removed the HOBO enclosure to see if the plastic enclosure was causing some of the minor discrepancies, and here’s what we ended up with after about a week of co-located measurements:
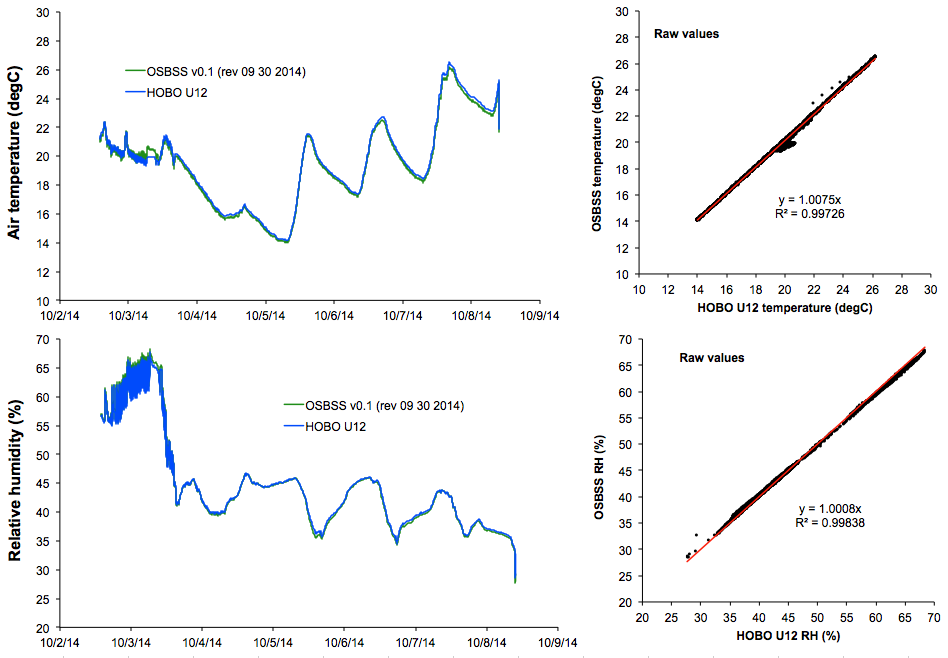
Outstanding!!!! After removing the HOBO enclosure, the OSBSS logger values are directly in line with the HOBO values (for both T and RH). We’re talking a slope of 1.0 and R-squared of 0.997 or higher for both over a week of data collection, with a relatively wide range of values from 14 to 28 degrees C and 30% to 70% RH! While this large range may reflect pretty poorly on on the ability of my building, Alumni Hall, which was built in 1946, to maintain consistent indoor environmental conditions, I’m extremely happy to see such close correlation over a wide range of T and RH typically found in buildings. Great work OSBSS team! (and particularly Akram, who has made huge strides in this work)