
Yesterday marked a momentous occasion for OSBSS: our first complete build of a custom sensor by a non-expert (me!) using our first online tutorial. After about 9 months of work and many stops and starts with various boards, sensors, software, and design concepts, the development team (Akram Ali and Zack Zanzinger) has successfully developed their first low power data logger built on the Arduino platform. It even has its own GUI to launch the logger! The first logger is designed to measure temperature and relative humidity (read the tutorial here). But the really cool thing is that now they have the basic design for a custom data logger with low power draw and a long battery life that can be used to accept any number of other sensors that we are planning to build. We have already prototyped and sourced many of these others sensors, which, combined with the background legwork Akram and Zack have done, should allow for fairly rapid prototyping of new sensors and tutorials. Not bad for a team of architectural engineers without formal electronics training!
Here I will take you through my experience building my first sensor based on our first design and tutorial.
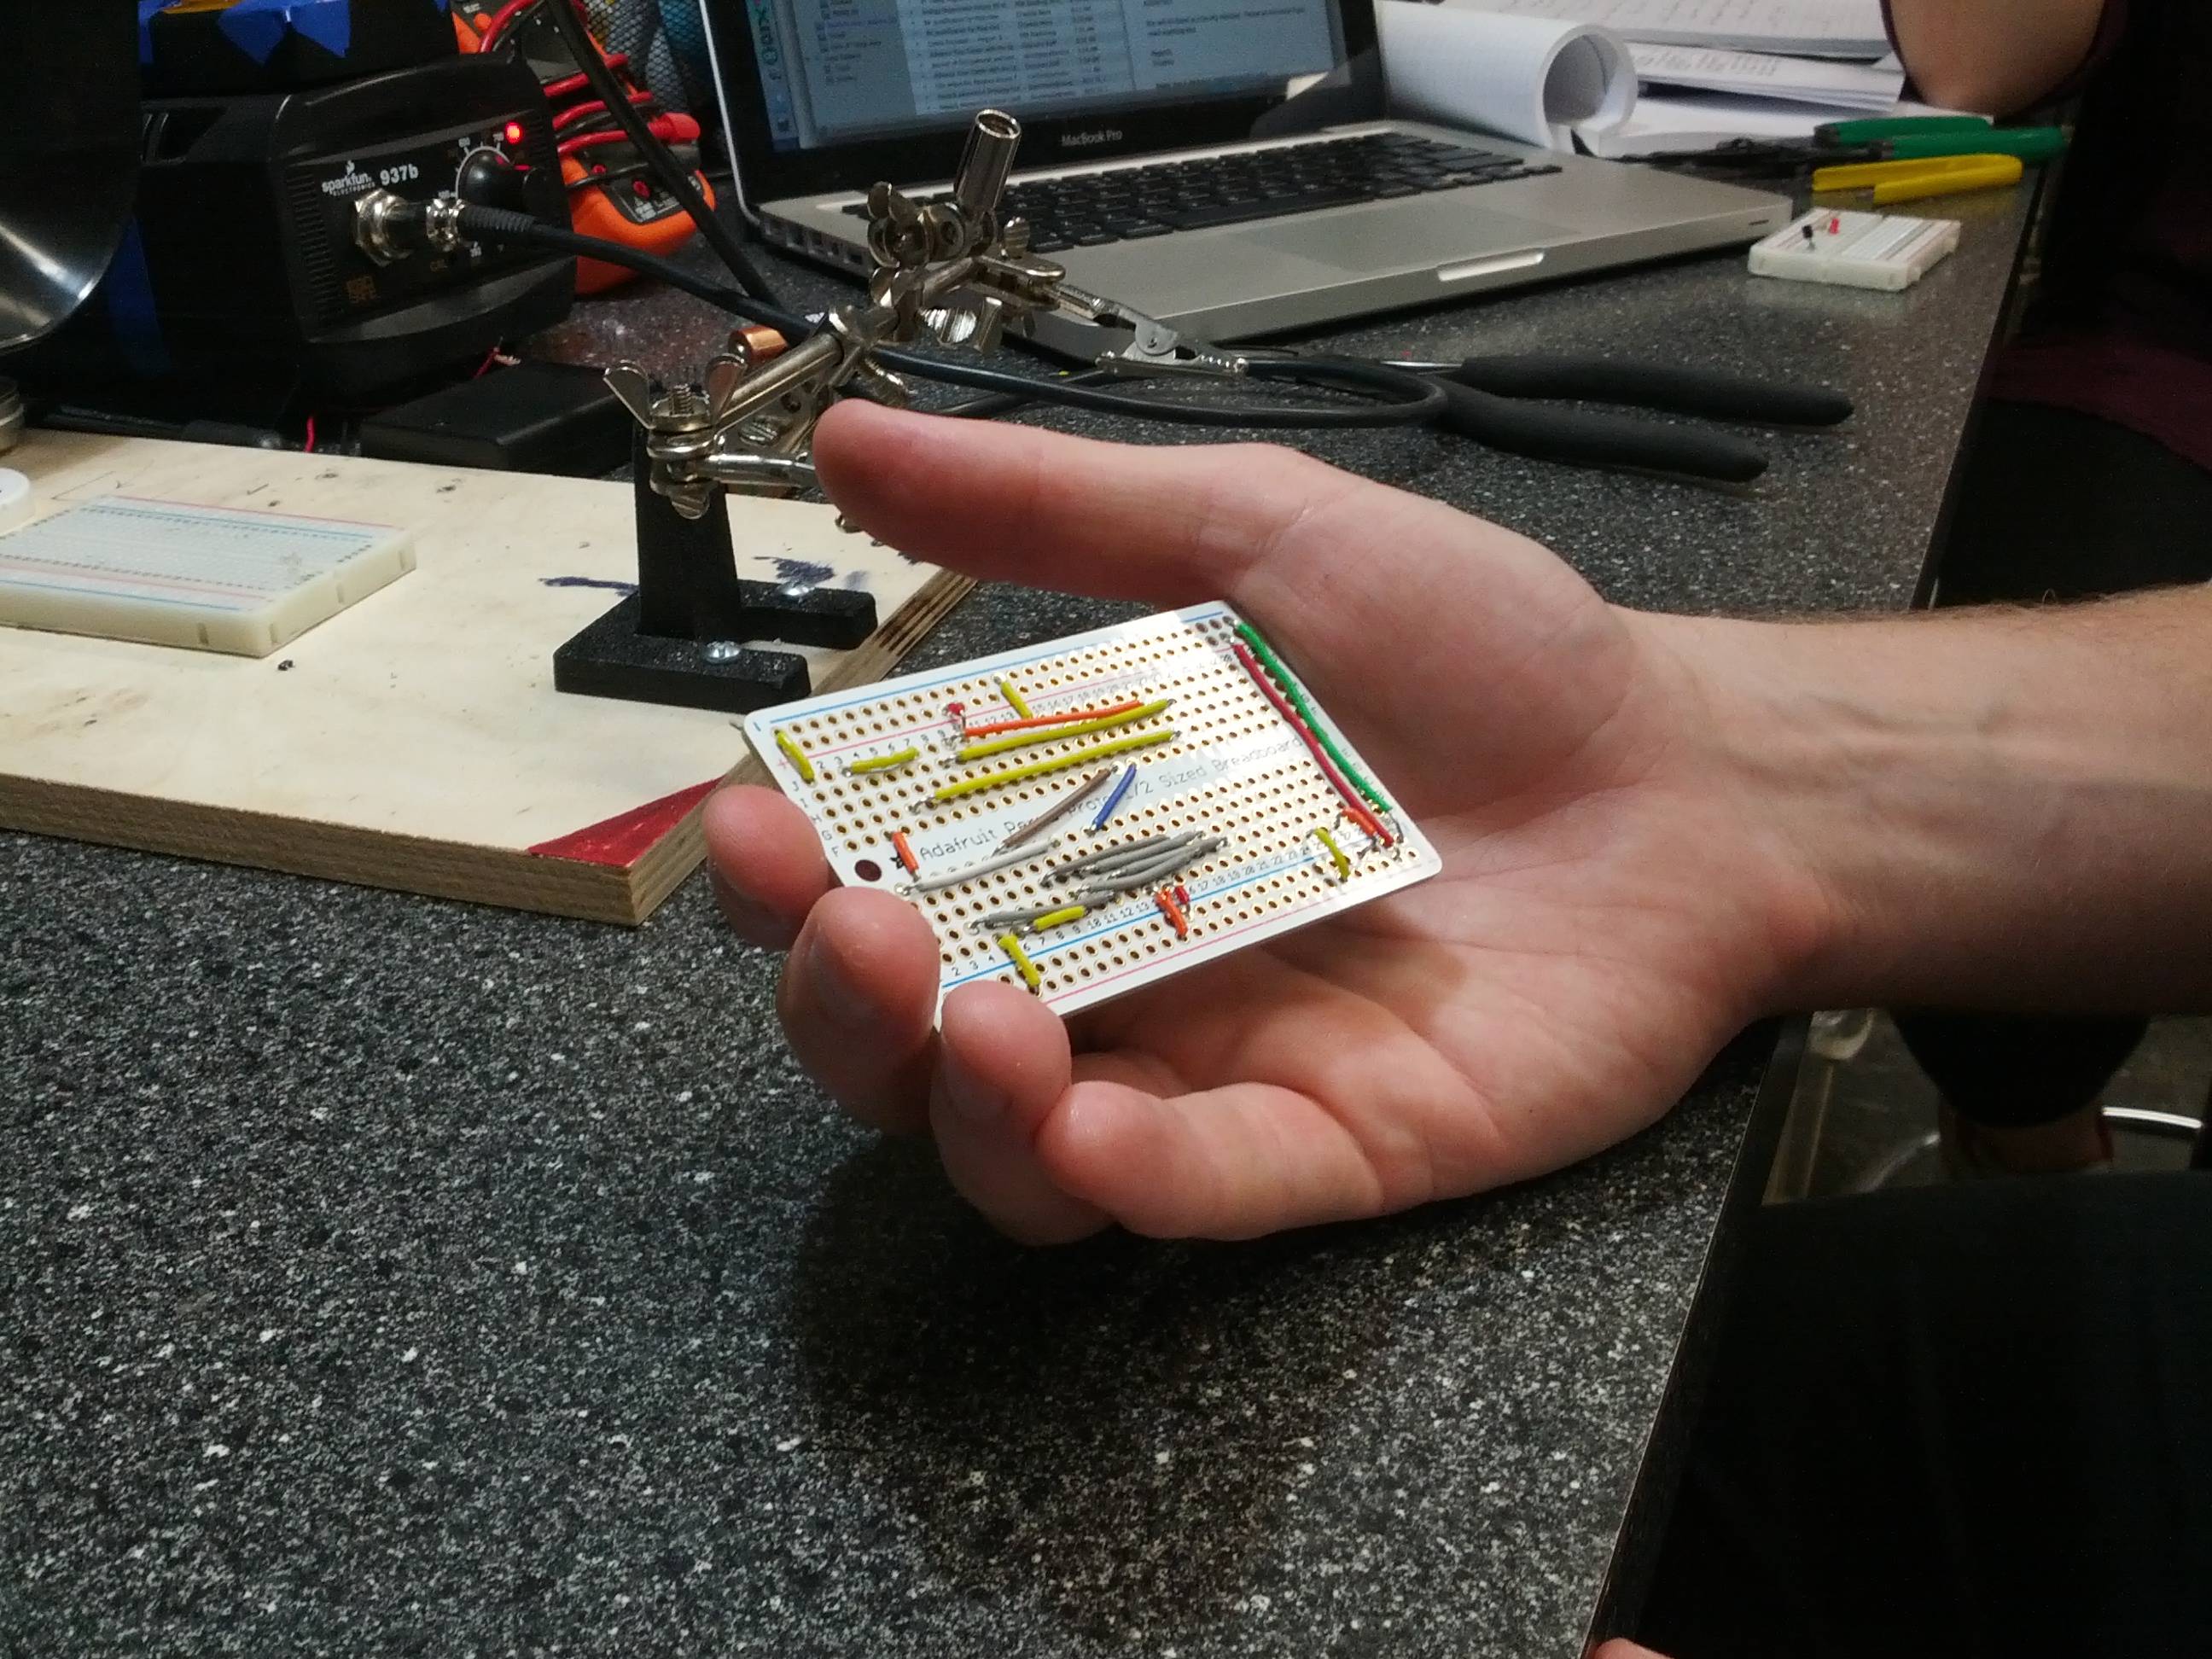
I began around 10:15 am on Wednesday August 6, 2014. I started with Step #1 of version 0.01 of the T/RH tutorial, gathering all the required parts and tools (okay, Akram and Zack gave them to me in a nice little package). I started laying out the wires on the solderable breadboard exactly as shown in the tutorial. Working with my PhD student Torkan Fazli, it felt like we were playing Battleship. Lots of “green goes from E7 to F17,” etc. This was an entirely mechanical and sort of soothing process — no thinking required and no need to even understand what you’re really doing (although as time went on it started to become more apparent, even for an electronics novice like myself). Just as I hoped for!
It took me about 30 minutes to place all the wires and bend them in place. Make sure that you bend as you place each wire, as you don’t want to flip the board over and have your beautiful placement disrupted by loose wires. I then spent the next 45 minutes soldering the wires and other components (1 transistor, 1 LED, and 2 resistors) in place. This could have gone a little faster had my soldering skills not been so rusty. But with a little guidance I started moving quickly with very few errors. I used this 50 W soldering iron from Sparkfun, set at about 675°F. I started at a slightly lower temperature but wasn’t getting very clean connections. Also be very careful to pay attention to polarity on the LED and the transistor!
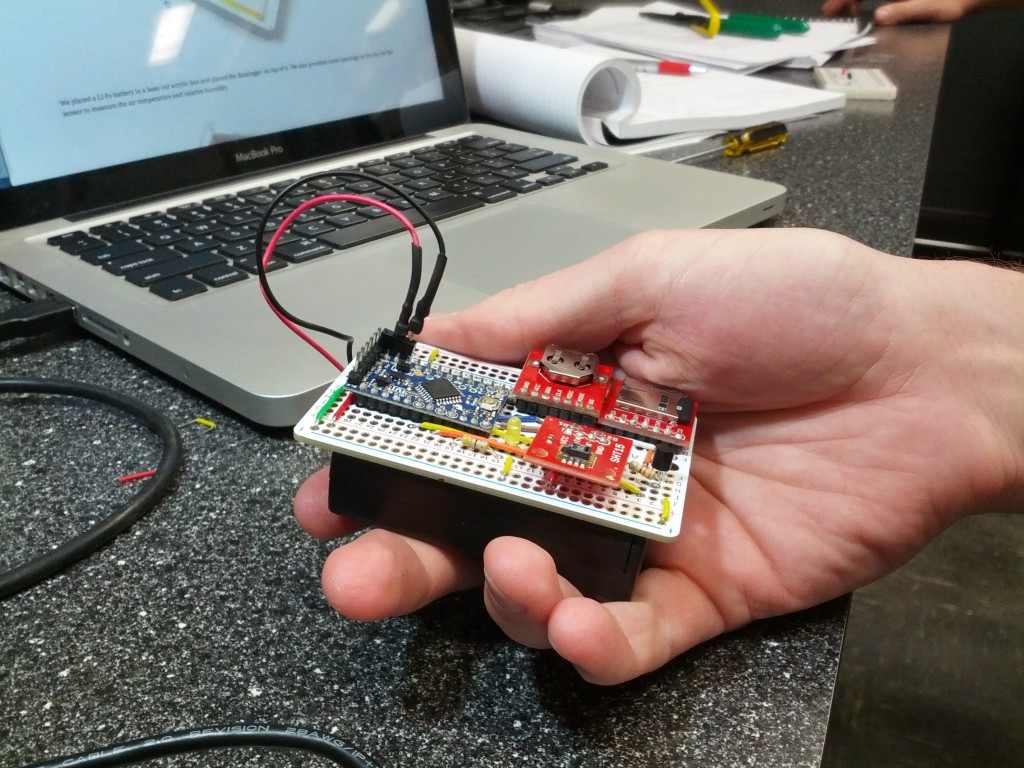
After clipping the excess wires from this effort, I moved on to installing the microSD card breakout, the SHT15 breakout, the RTC breakout, and the Pro Mini itself. Luckily these all already had headers soldered on them so it saved me some time (maybe an extra 10 minutes). It was a little tricky to solder them in place in a way that was aesthetically pleasing (i.e., not bent in odd directions), but I got a little help from Zack and started soldering just one pin in place with the board sitting on the bench, then I was able to pick the board up in one hand and quickly melt the soldered area just long enough to wiggle the pieces in place before removing heat and letting it quickly set again.
By the time I had soldered all of the pieces on the board, I was about 1 hour and 45 minutes in and ready to move to the software section. (I was also taking my time to explore different ways of connecting a battery pack, so I’m pretty confident that the first build could have taken less than 1 hour and 30 minutes).
The software portion was very straightforward, thanks to the very clear tutorial and well-written code. In fact, the software side would have only taken about 5 minutes if it weren’t for some connectivity issues that I had using my Mac (refer to the tutorial for more information). By 12:30 pm (2 hours and 15 minutes from starting), I had my own custom open source T/RH data logger fully built, launched, and logging at 10 second intervals! It would have taken less than 2 hours had I not had issues connecting to the board (which was entirely an issue with a virtual COM port driver on my Mac – not the OSBSS device itself).
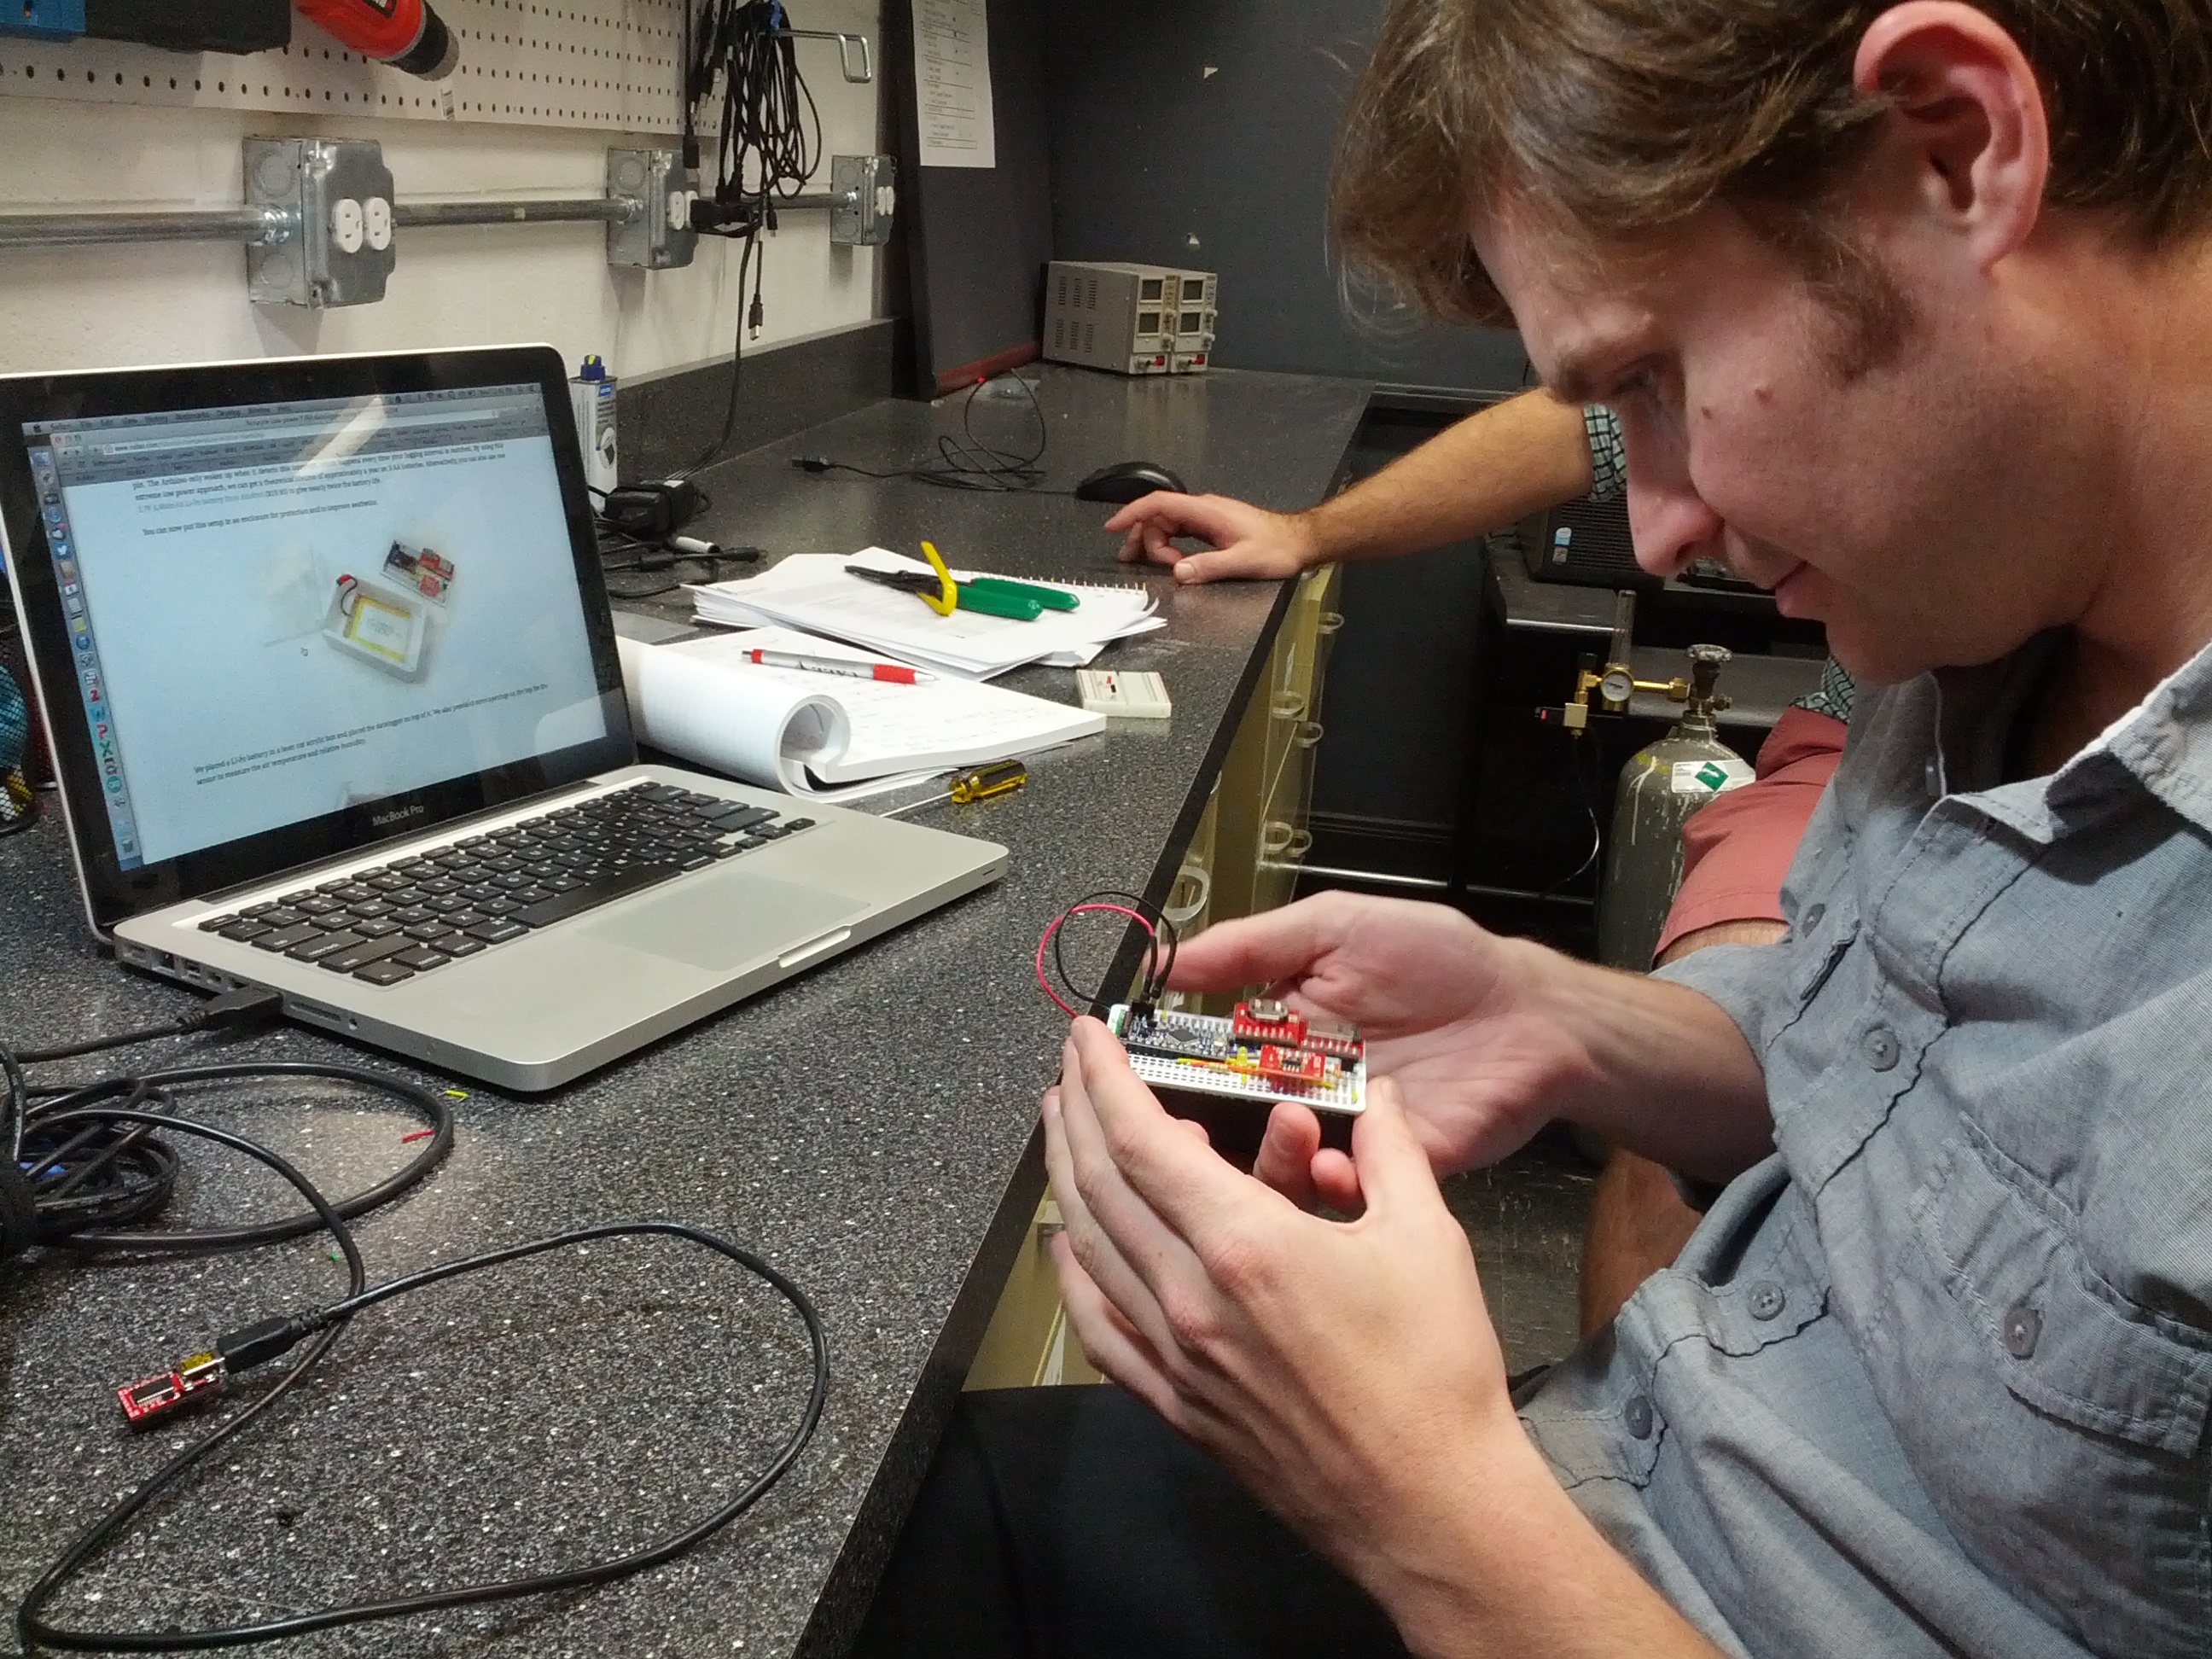
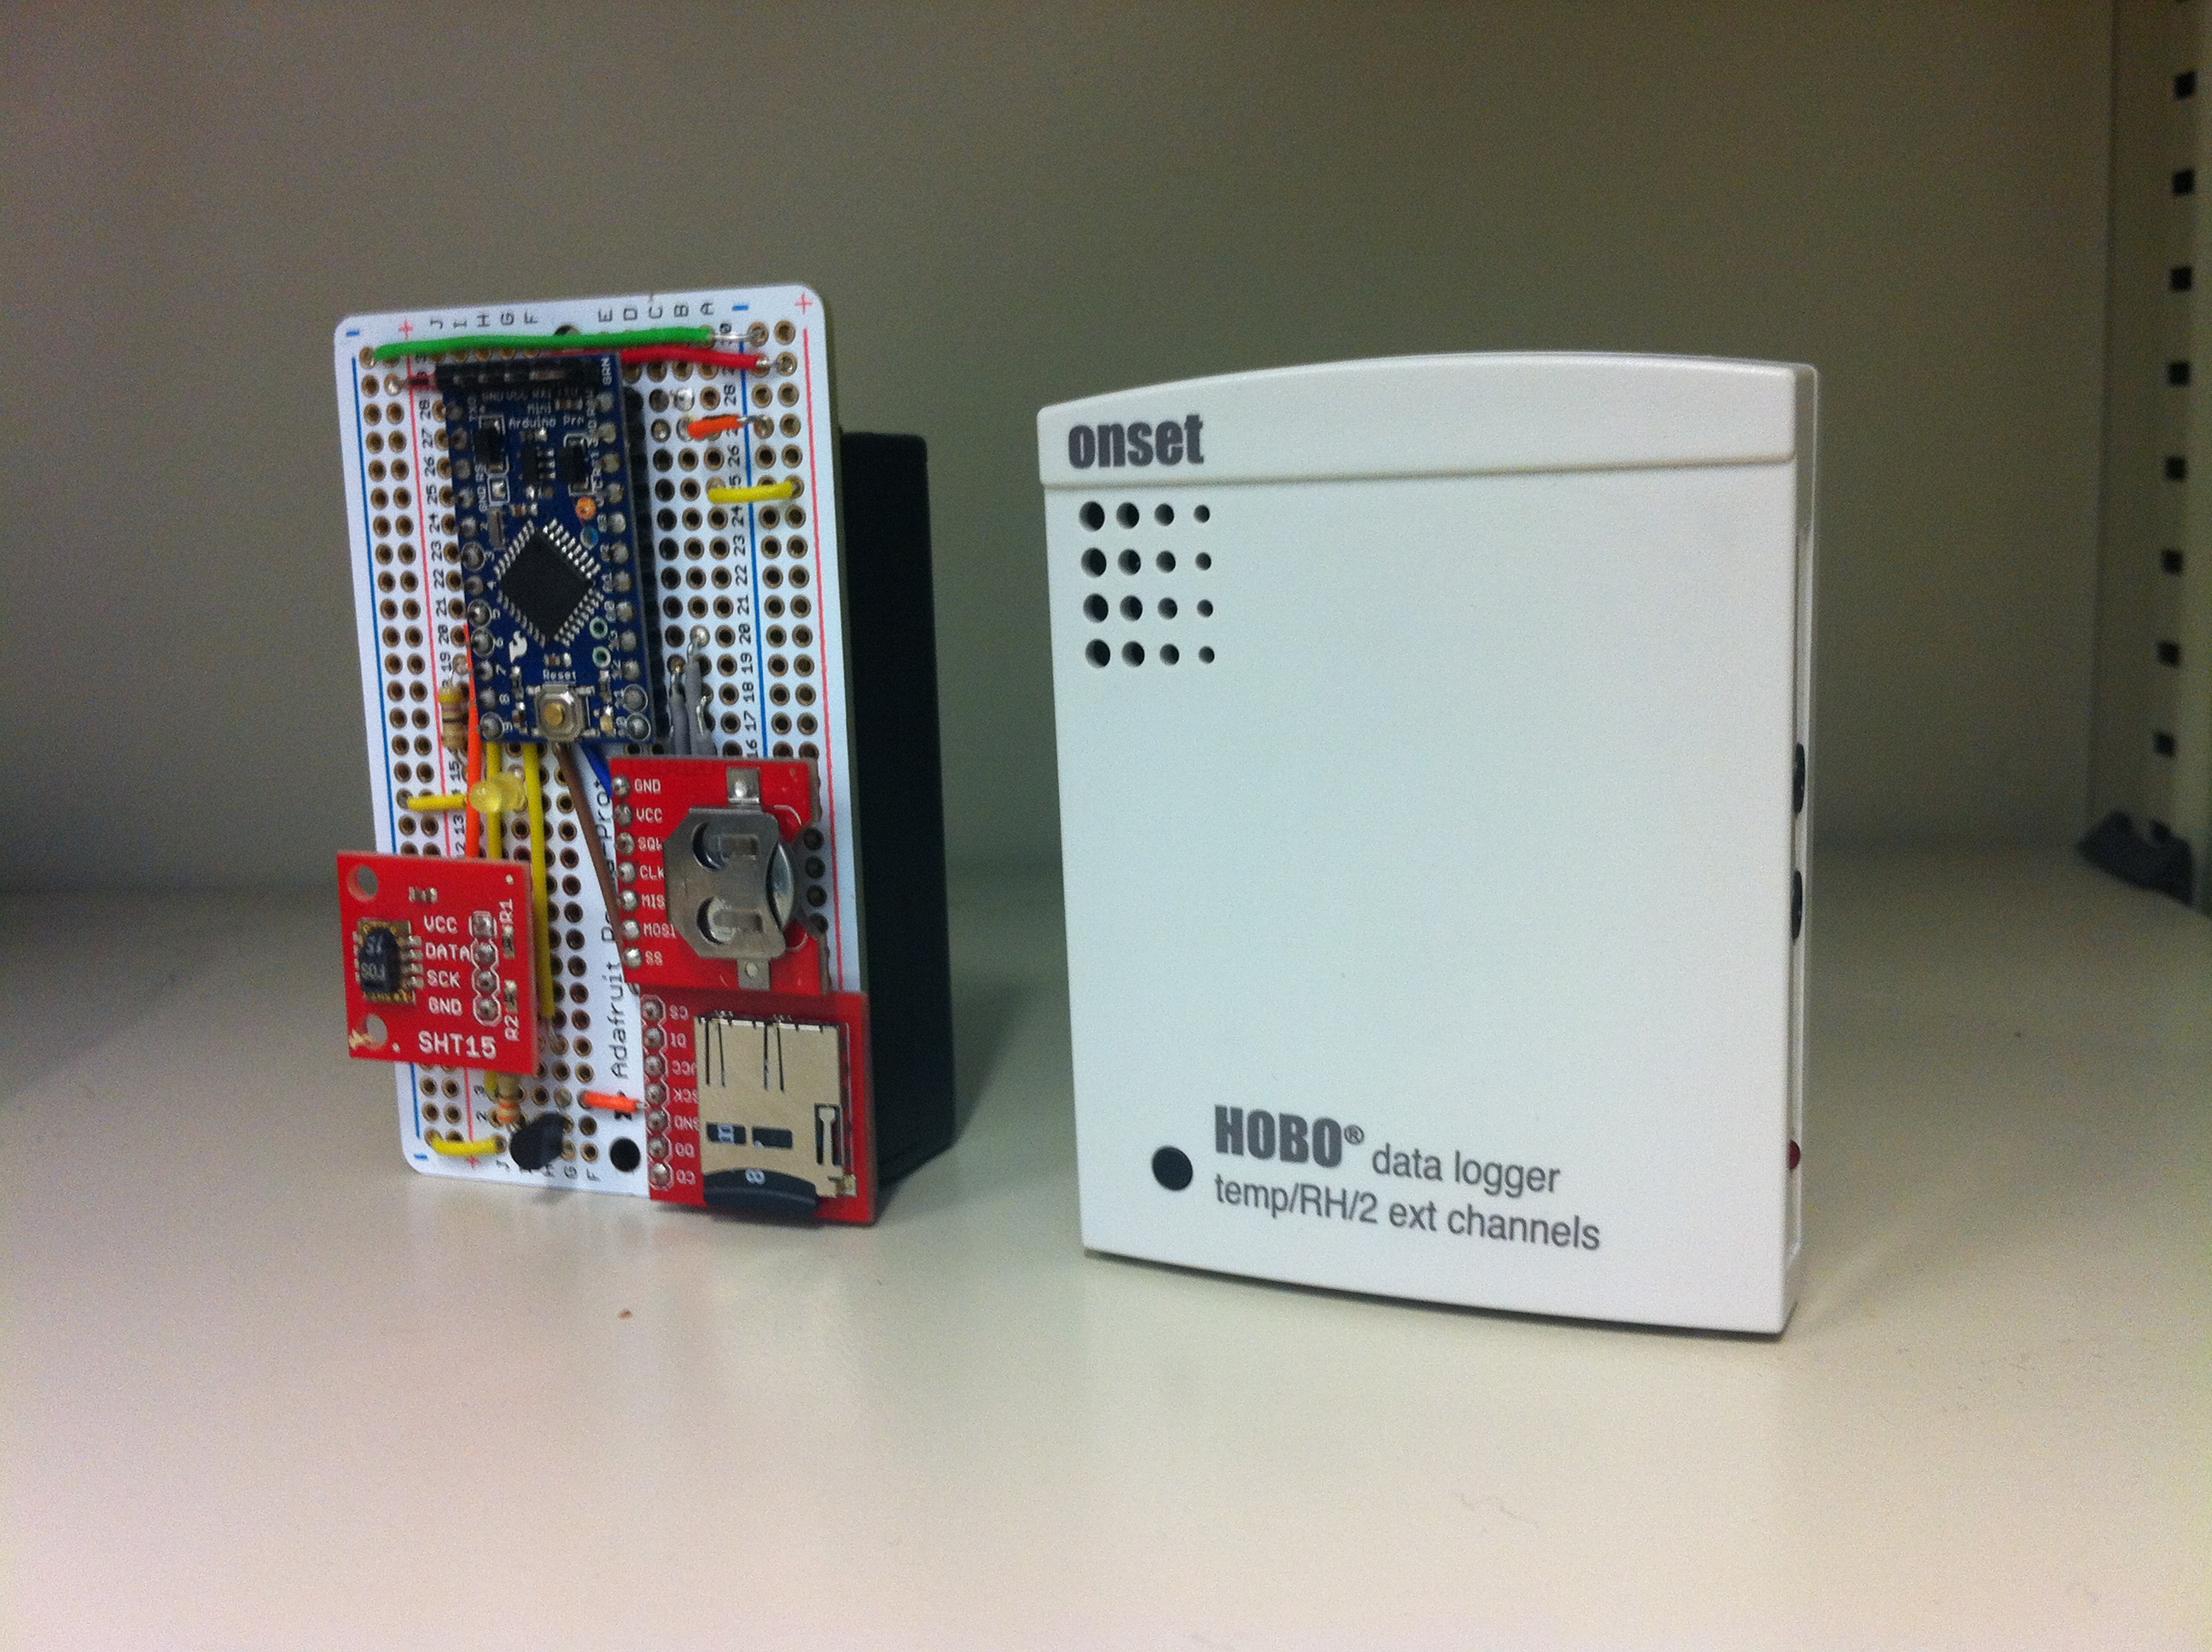
From there, I re-launched my new battery powered logger to log T/RH at 1-min intervals and set it in my office on a shelf next to an Onset HOBO U12 logging at the same interval. You’ll see the LED blink in the video below when data are being written to the SD card:
Now, how well did my sensor perform against the HOBO?? Let’s take a look….
Below are two time-series graphs showing temperature and relative humidity measured by the two sensors over a period of about 20 hours in my office:
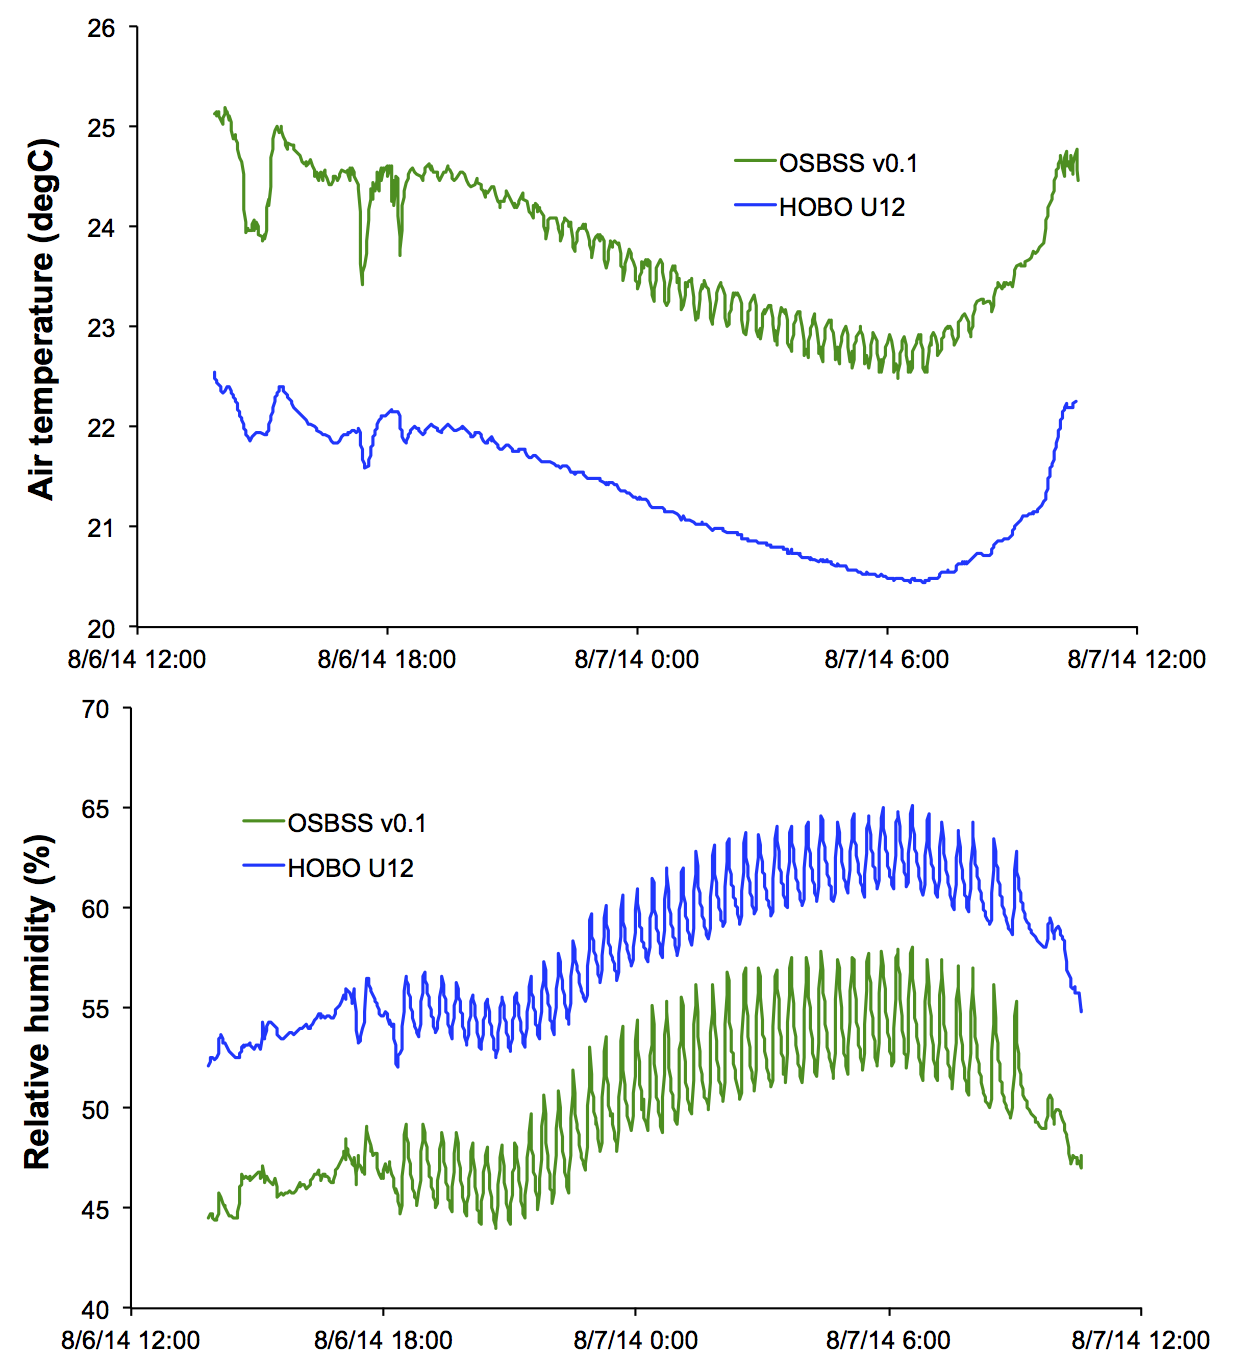
Looking at these data, I would say that the results were both highly encouraging and a bit discouraging at the same time. The encouraging part is that the overall response pattern of the OSBSS v0.1 sensor is excellent. Just about every peak and valley in both T and RH over the course of the day and night corresponds very well with the HOBO. One thing you’ll notice is that some of the peaks and valleys in the OSBSS data are larger in magnitude than those with the HOBO. My guess is that the issue is largely related to the OSBSS sensor being exposed directly to the open while the HOBO is housed in a small plastic enclosure, providing some thermal mass which may have guarded against wilder swings. I am going to repeat this testing with the HOBO housing removed and see if this changes.
Now, I’m avoiding the larger issue: the gulf in absolute magnitude of readings between my OSBSS sensor and the HOBO. Temperature was consistently 2-3°C higher at every time step with the OSBSS sensor versus the HOBO sensor (mean difference of 2.4°C). RH was consistently lower with the OSBSS sensor, with a mean difference of -8% RH. This is not what I was hoping for!
Let’s take a closer look at how well these two correlate against each other:
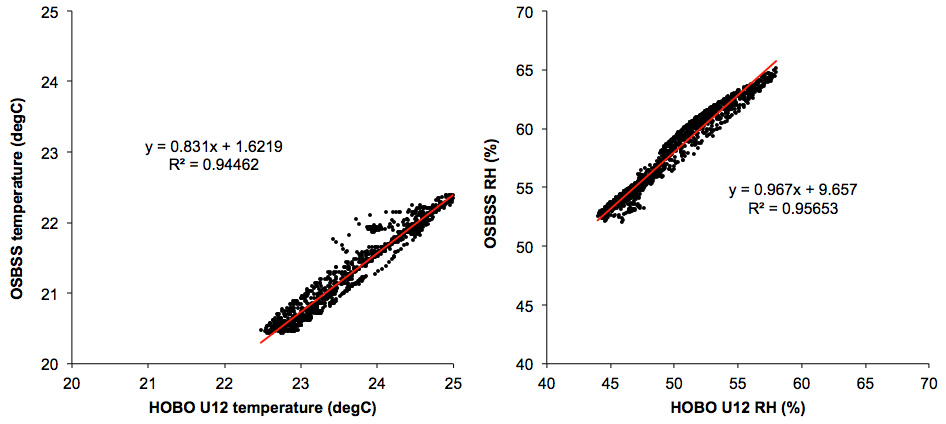
Hmmm… another combination of good news and bad news in my opinion. RH looks better than temperature, with R2 over 0.95 although there is a large offset of almost 10% RH. Temperature looks quite discouraging, with R2 slightly less than 0.95, a slope much less than 1.0 (0.831 to be exact), and an offset of about 1.6°C. Some of this may be thermal mass related, but my sense is that the SHT15 sensor is also not as accurate of a temperature sensor (but solid as an RH sensor). If you open the HOBO, you’ll see that it uses an SHT75 RH sensor for RH and a separate small thermistor for temperature. We will probably need to explore using a similar setup in our custom data logger if we want to measure temperature accurately.
Last, if we calibrate our raw OSBSS T/RH data to the HOBO T/RH data using the slope and intercepts from the linear regression of the raw data, we get the following:
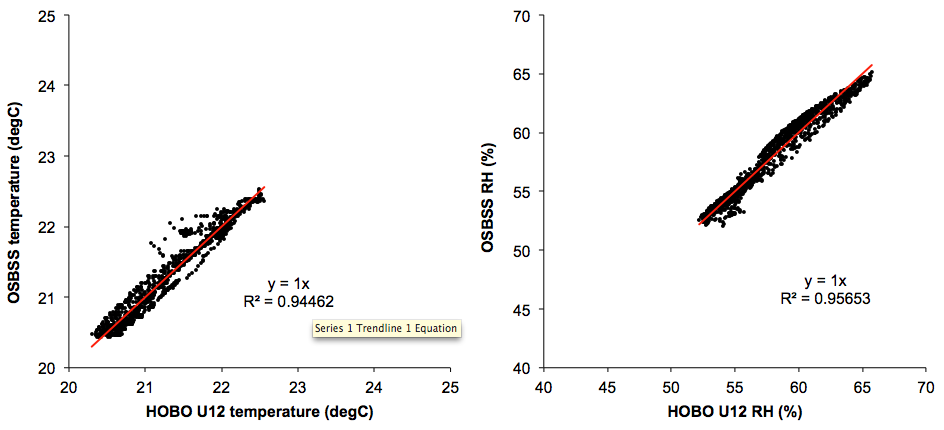
Basically, we can get very reasonable measures of temperature after calibration using this co-location method. The average difference between OSBSS temperature and HOBO temperature after calibration is only 0.1°C, while the average difference in RH is only 0.6% RH. Given that acceptable uncertainty in T is typically 0.2 or 0.3°C and RH is typically within 3%, these measurements actually seem quite reliable, as long as they are calibrated. But I personally think it is probably too cumbersome to have to calibrate each T and RH sensor against some higher accuracy version before deploying in the field. But it may become a necessary evil if we can’t figure out a better way of measuring T/RH. I’ll post again once I have the data from the OSBSS versus HOBO U12 without a cover to explore any impacts of thermal mass in the case.
I would have to say that overall I am still very encouraged with our progress. Temperature is actually one of the tougher measurements to get right, believe it or not.
I encourage you all to try your hand and building this open source T/RH sensor using our tutorial and giving us feedback on your experience!
Update: August 8, 2014 – Comparison to HOBO U12 without enclosure
Below you can see data from another day of measuring T/RH with my OSBSS sensor against the HOBO U12, this time without the enclosure surrounding the HOBO:
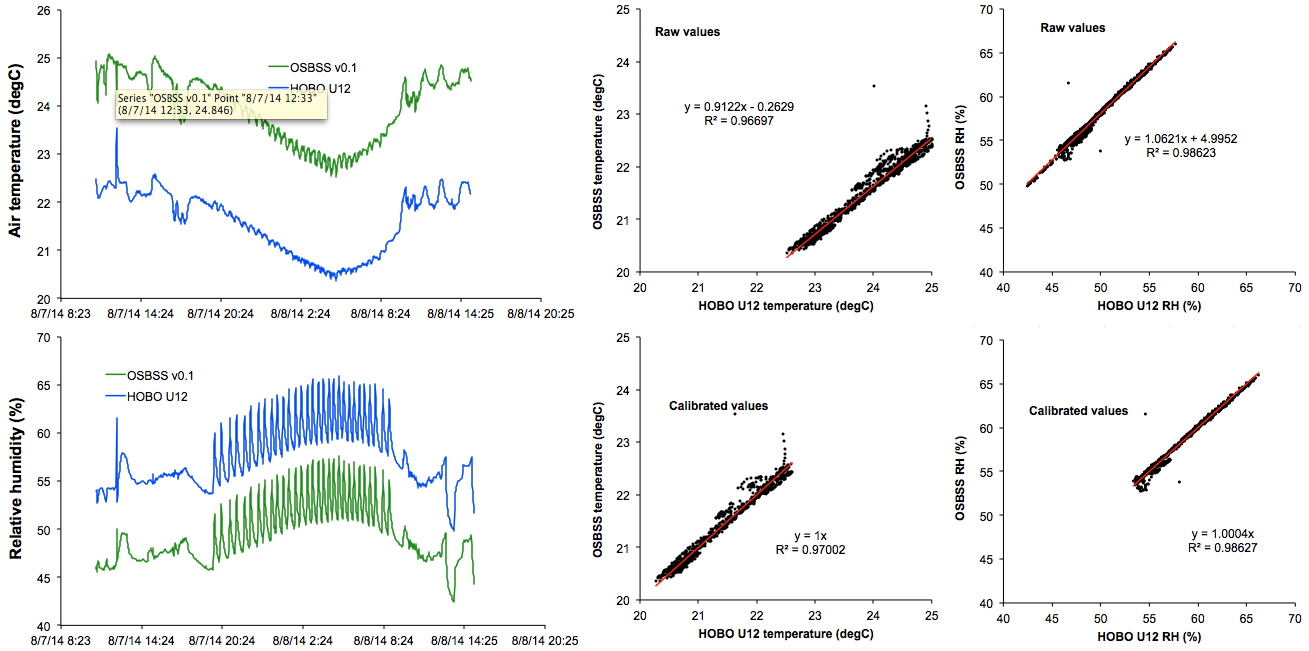
What we see is much of the same. The HOBO enclosure doesn’t seem to influence the magnitude of peaks and values in temperature too much, as the OSBSS sensor still has larger variations. Onset might use some kind of smoothing or averaging algorithm for temperature, or it could be a difference in thermistor versus SHT measurements. (The same calibration issues persist and look quite similar to the day before). The magnitude of peaks and values on RH do seem to be a bit more in line between OSBSS and the U12 with its enclosure removed, which is encouraging.
The offset in RH may also have to do more with the poor temperature measurement, because the SHT15 uses temperature (in part) to calculate RH. So with the OSBSS temperature reading higher than the U12, it makes sense the OSBSS reads a lower RH. In fact if we just grab one line of data (17:32 on August 7), we see that the OSBSS sensor reads 23.9°C and 48.8% RH. The U12 reads 21.7°C and 56.1% RH. Using psychrometrics calculations, OSBSS yields a humidity ratio of about 9.03 g/kg. The U12 yields a humidity ratio of 9.1 g/kg — not bad! If we were to hold the humidity ratio constant at 9.1 g/kg and adjust our temperature down to the same 21.7°C that the U12 reads, we’d get an RH of about 56% — same as the U12. So it really does seem to me that accurate temperature measurements are really the heart of this device.
Now that we have the framework of this battery powered logger, we’re now exploring the use of higher accuracy thermistors for temperature measurements — we will update on this progress soon.