
Low power temperature and relative humidity datalogger using SHT15 and DS3234 RTC
// Version 0.03, Last updated on: March 30, 2015
The temperature and relative humidity of indoor air is an important parameter that can influence indoor microbial survival, abundance, and community structure (Ramos and Stephens 2014, and references therein). Temperature and relative humidity can also be used to infer other information about indoor environments, such as whether or not it is being heated or cooled. Data loggers like the Onset HOBO U12 provide a robust solution for logging temperature and relative humidity at specified time intervals ranging from 1 second to 18 hours. A single HOBO costs around $140. Onset’s software, HOBOware, is also required for launching the device and reading data from it and it costs an additional $99.
The following tutorial will guide you through the process of building your own open-source low power T/RH data logger based on the Arduino platform and built on a robust solderable breadboard format, as shown in the pic below. The sensor and data logger combination is designed to measure T/RH with similar accuracy to the Onset HOBO devices and store the data onto an SD card at specified intervals. The goal is to achieve approximately 8-12 months of battery life with 3 AA batteries or over 12 months with a 2,500 mAh Lithium ion polymer battery.
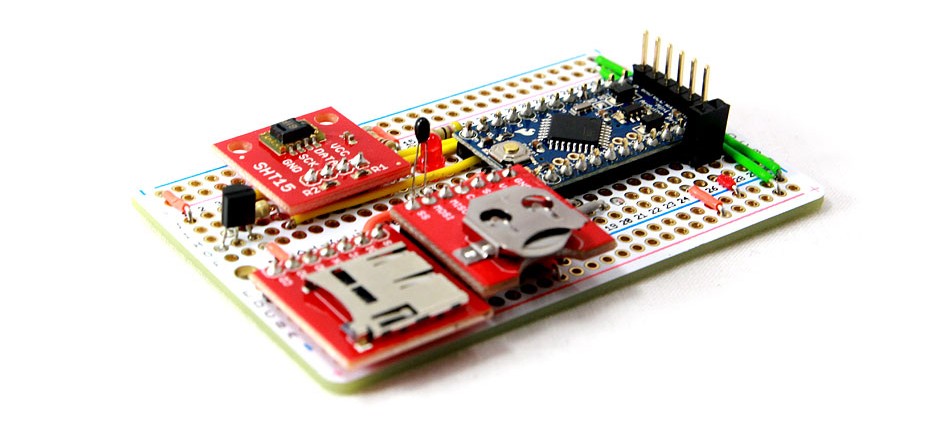
Figure 1. Assembled OSBSS temperature and relative humidity logger
Difficulty Level: Beginner, soldering skills required, little to no electronics knowledge required.
Time required: 1-2 hours, depending on experience and skill.
Important:
- If you are not familiar with how a breadboard works, check out a simple tutorial by SparkFun. We built our first prototype on a regular breadboard, but this tutorial uses a more robust solderable breadboard which makes the logger more compact and durable.
- You will need some soldering skills for this project. If you are new to soldering, check out SparkFun’s soldering tutorial.
STEP #1: What you will need:
Parts requirements:
Arduino Pro Mini 328 3.3V/8MHz ($9.95) — we used these less expensive 3.3V clones (< $3.00)
DeadOn RTC DS3234 Breakout ($19.95)
CR1225 coin cell battery for the RTC ($1.95)
SHT15 Humidity and Temperature Breakout ($41.95)
US sensors ‘ultra precision’ thermistor (10,000Ω resistance) ($8.00)
SanDisk microSD memory card 4GB (or any other capacity; we recommend SanDisk because of reliability issues with others) ($6.29)
microSD Transflash breakout ($9.95)
Adafruit Perma-Proto Half-sized breadboard PCB ($4.50)
Transistor – NPN ($0.50)
LED Basic Green 3mm ($0.35)
3 AA batteries and battery holder ($1.95) or one Li-Po 3.7V 2500mAh battery ($14.95)
Note: Headers are not included with some components. You may have to buy them separately.
Total parts cost: between about $90 and $110
(If you are familiar with designing and etching PCBs, buying SMD parts of various components listed above rather than the breakout boards will result in a much lower expense.)
Required accessories:
FTDI Basic Breakout 3.3V ($14.95)
Jumper wire kit ($6.95)
Resistor kit ($7.95) (we will use three resistors: 47Ω, 330Ω and 10,000Ω)
Soldering iron ($44.95 or $9.95)
Various common tools including needle-nose pliers, wire cutters, and solder
Software requirements:
Arduino IDE (1.0.5 or higher)
Arduino libraries required:
SDfat library (by William Greiman) – Pre-Aug. 2014 commit
OSBSS SHT15 library
OSBSS DS3234 RTC library
OSBSS PowerSaver library
*You can view and download OSBSS libraries from GitHub.
Note: The SHT15 sensor is a very accurate, pre-calibrated temperature and relative humidity sensor from Sensirion. Similarly, the DS3234 is an extremely accurate real time clock from Maxim and the US sensor thermistor is ultra precise, providing 0.05°C accuracy. There are less expensive and less accurate alternatives for these products, but our tutorial is aimed towards people who are interested in gathering data for research applications that require high precision and accuracy. This means that any specific hardware setup and software setup (libraries, program code) is strictly meant for the specified products only.
If you are interested in a much simpler, albeit less robust, temperature and relative humidity datalogger, check out our detailed tutorial using the DHT22 and Arduino Uno.
STEP #2: Assembly
The assembly of the board is straightforward, especially if you already have some experience in soldering electronic components. We will be using Adafruit’s Perma-Proto half-sized breadboard. This is board has the same layout as a typical half-sized breadboard, but requires all components to be soldered on it. This gives us the advantage of having strong connections and ensures the robustness of the data logger.
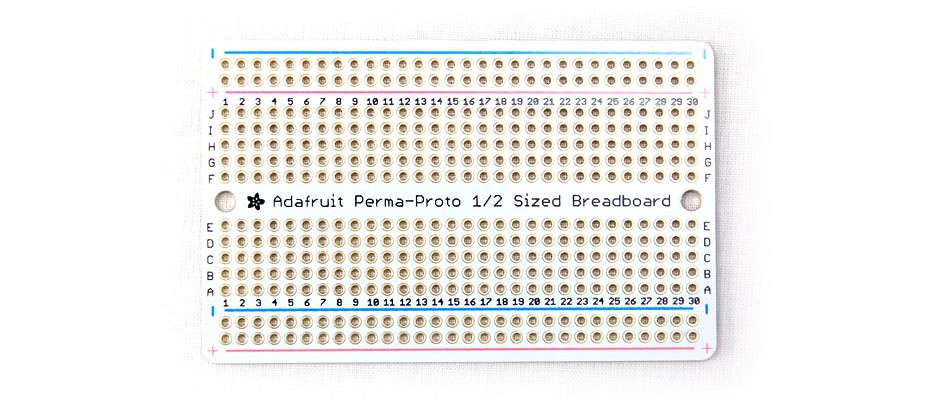
Figure 2. Solderable breadboard from Adafruit
This is what we want to achieve:
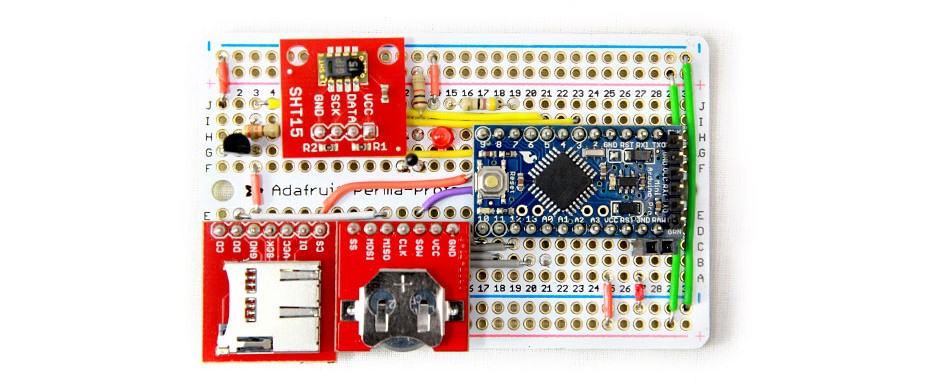
Figure 3. Top view of an assembled OSBSS temperature and relative humidity logger
Start by placing all the wires first, as some larger parts will sit on top of them. Cut the wires in appropriate sizes and arrange them as shown. Be careful to leave just the right length of insulation around each wire such that the wires can remain relatively flat against the breadboard while also not shorting across other wires or connections. You can use various sized jumper wires from the kit or cut your own to the appropriate lengths. Use the numbers marked on the protoboard to help arrange the wires at the exact location. The arrangement of the wires will start making sense as we progress further in the tutorial.
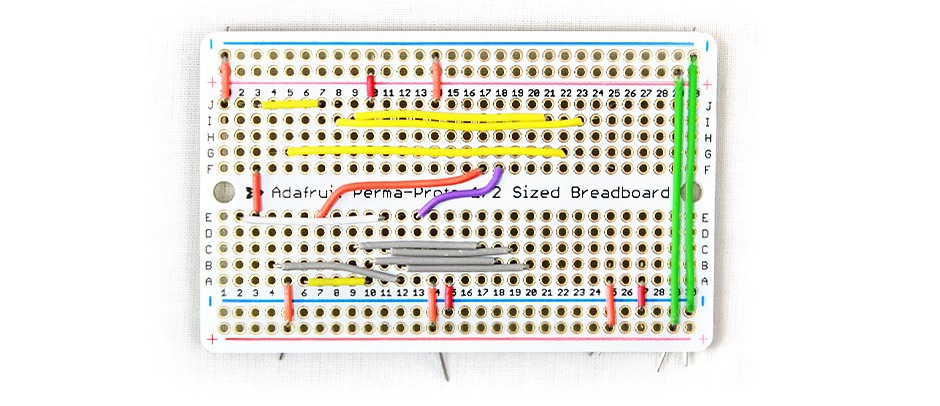
Figure 4. Wiring arrangement (top view)
Turn the board upside down and arrange two more wires as shown. The numbers indicate those marked on the protoboard to help locate the position. The great thing about this protoboard is that you can wire components from the top and bottom, effectively making this a “partial” dual-layer board.
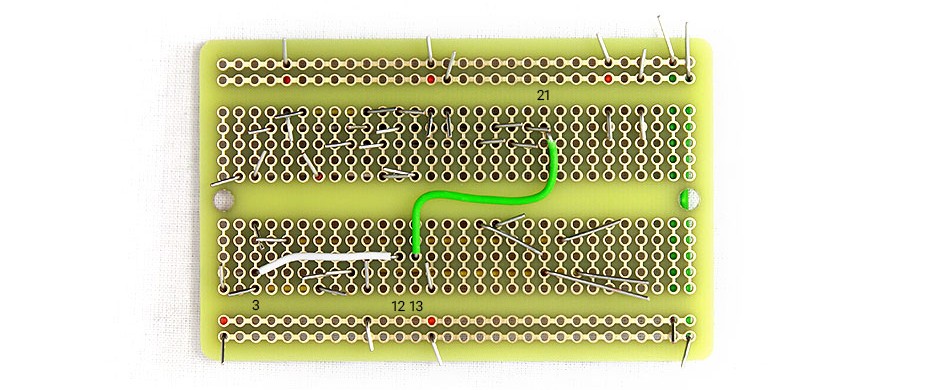
Figure 5. Wiring arrangement (bottom view)
The outline of the wires shown in Figure 6 below indicate where the two wires actually go under the board.
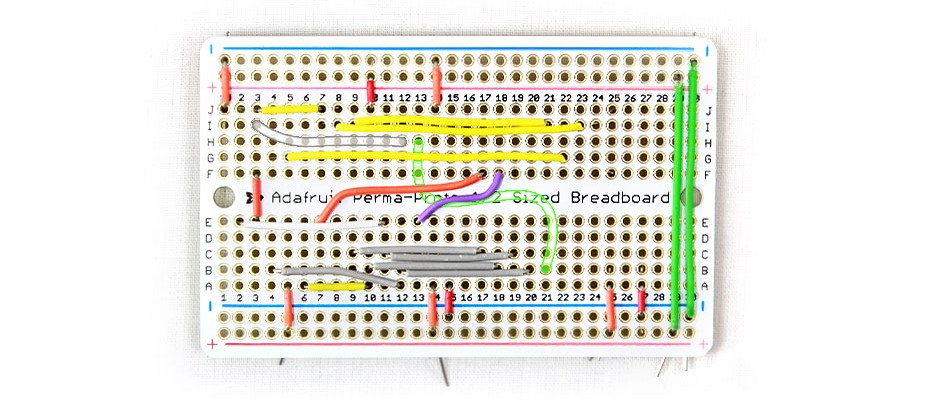
Figure 6. Wiring outline (top and bottom)
Bend the ends of the wires to ensure that they stay in place. Be sure to bend as you go so the wires stay held tightly. Now you can solder each wire to the breadboard, while making sure each pin hole is completely filled with the solder. You can solder the holes from either side, whichever is easier, but make sure not to melt the wire insulation when soldering from top. Tools like the Third Hand are very helpful here to hold the board in place. We use SparkFun’s Special Blend solder. We feel that 0.020″ (0.5mm) solder wire works best for prototyping.
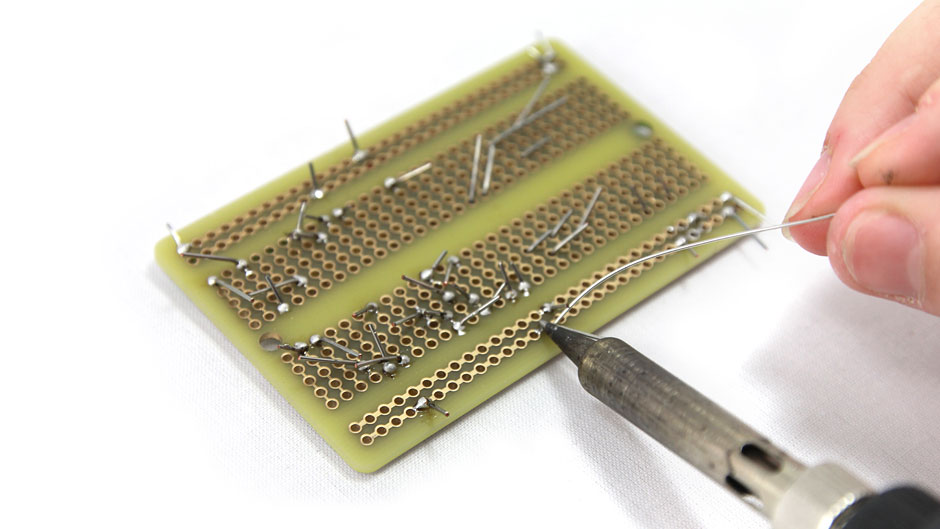
Figure 7. Soldering the wire connections
Once all wires are soldered from the bottom, let the board cool down for a minute or two. Now clip off the ends of the wires that you bent earlier. We don’t need those anymore. Be careful when clipping wires as they can shoot off quickly. We recommend wearing safety goggles and clipping wires in an enclosed area (such as under a desk or into a boxed enclosure).
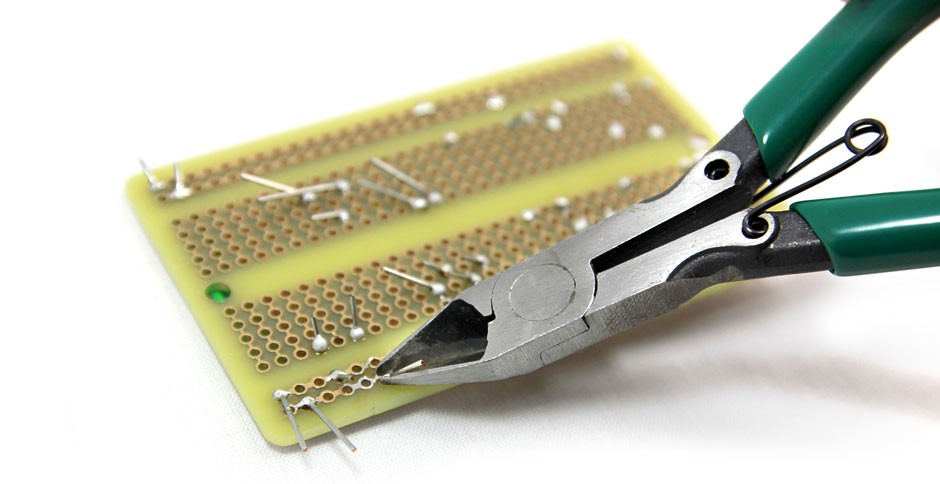
Figure 8. Clipping the wires
Now we can start placing smaller electrical components, like the transistor, the LED, and the three resistors. The transistor is used to control power going to the microSD card breakout, the thermistor and to the SHT15 sensor for reducing overall current draw of the data logger. SparkFun has a detailed and well-explained tutorial showing how a transistor works. Be careful to orient the transistor exactly as you see it in Figure 10, with the flat part facing away from its accompanying 330Ω resistor (which is connected in series to the transistor’s middle pin). The LED is used as a visual indication of whenever data is written to the SD card. Be very careful with the polarity of the LED when installing. The 47Ω resistor is connected to the positive side of the LED (the curved end with a longer pin), while the other end of the LED goes to ground (this is the shorter wire closer to the flat edge of the LED). The 10,000Ω resistor is used in series with the thermistor (which will be placed later). Note that the resistors used are not polarized; i.e., they can be placed in any orientation without worrying about which leads are positive or negative.
Before soldering the 10kΩ resistor, we can measure its actual resistance with a multimeter. We observe that it’s not exactly 10,000Ω, but varies slightly. Note this value down, as we will use it in the code in Step #4. While this step is optional, since the resistance displayed by the multimeter itself may be a little skewed depending on its accuracy, in most cases it may help in slightly increasing the accuracy of the readings given by the thermistor.
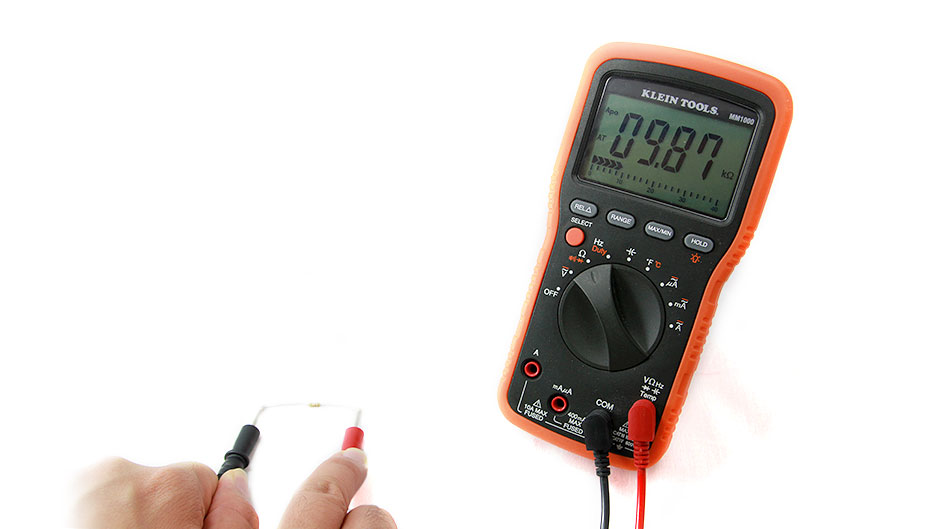
Figure 9. Measuring resistance with a multimeter
Place the small components and repeat the same procedure with these as well: insert components, bend the wires, solder the parts and finally clip off the leftover wire.
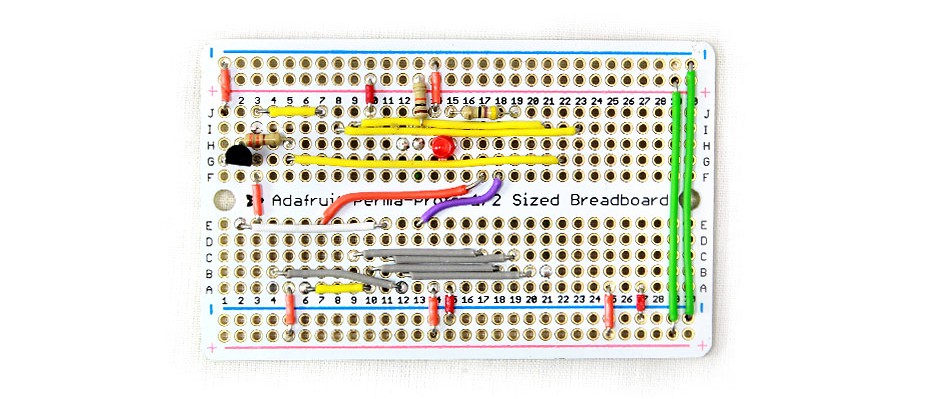
Figure 10. Adding base components
Now that we have our base circuit ready, we can start placing the main components, which are the microSD breakout, the DS3234 RTC breakout, the SHT15 temperature and relative humidity sensor breakout, the thermistor and the Arduino Pro Mini 3.3V.
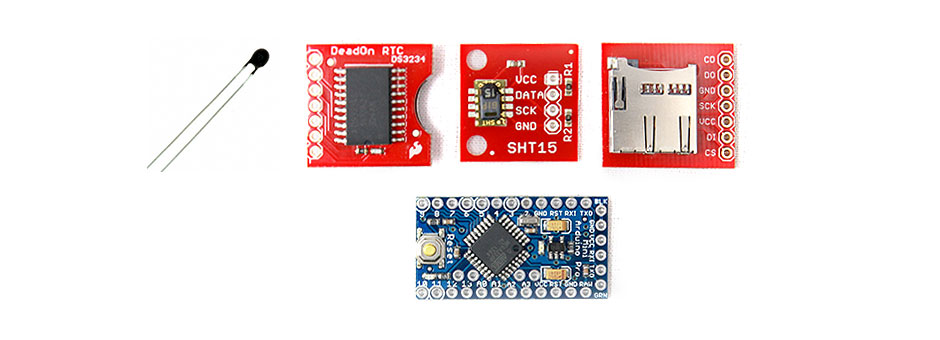
Figure 11. The main components: thermistor, RTC breakout, SHT15 breakout, microSD breakout, and Arduino Pro Mini
First, we will need to solder some headers on the components with through-holes (except the thermistor). The Arduino Pro Mini requires the top 6 pin headers to be soldered facing upwards or on the side, since these pins are what you will use to program it. SparkFun has a neat tutorial explaining how the Pro Mini works and how to use it.
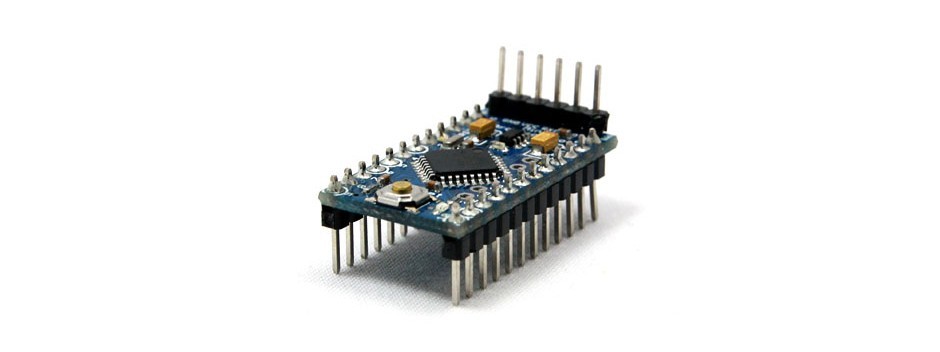
Figure 12. Arduino Pro Mini with headers
Important Note: We have disconnected the red power LED and green status LED on the Pro Mini by cutting out the traces connecting them. This neat tip was provided by a user on SparkFun for disconnecting the voltage regulator (do not disconnect the voltage regulator however – more on this below) and we used the same technique on LEDs. The LEDs significantly increase the current draw and since we want to control our own LED, we don’t really need them. Be careful when you do this — you need to cut the trace with a sharp blade until the circuit is physically broken. But you don’t want to damage any other adjacent components while doing so. You may actually want to try this step before soldering the Pro Mini to the breadboard. Removing the green status LED from the circuit is important for low power, but also becomes necessary when using Pro Mini clones and SPI devices. If you look closely, some clones have a 470Ω resistor, while some even have a 1,000Ω resistor connected in series with the LED. In comparison, the original Arduino Pro Mini has a much lower 330Ω resistor. Since this LED is connected to pin 13 (SCK) on the Arduino, having a large series resistance on this pin can interfere with data transmission between some components on the SPI bus and may result in partial data loss.
Cut the traces for both LEDs as indicated by the red lines in Figure 13 below.
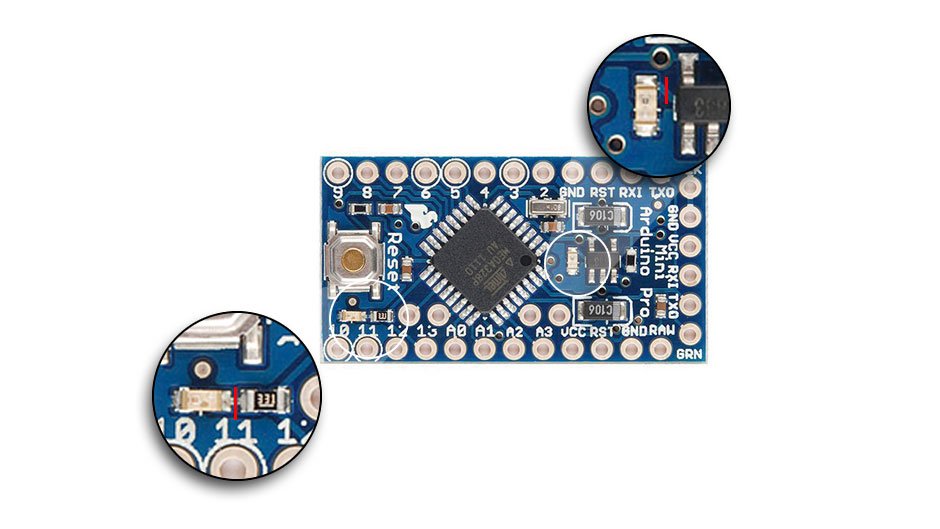
Figure 13. Cutting the traces to onboard LEDs on the Arduino Pro Mini
Now, let’s place each component on the board in the appropriate place and solder them one by one. Refer to the overlay of the larger components and the completed datalogger below (Figure 14 and Figure 15) to give you an idea of exactly where to place the wires on the board. The pins marked in blue will help you locate them properly. Be careful when soldering the US sensor’s thermistor – it has extremely fragile leads.
Note: When soldering the boards, if you are having trouble getting them to line up nicely (i.e., the boards aren’t parallel to your main breadboard and your headers aren’t at a 90° angle), you may want to start by soldering just one pin to anchor the board first. Then you can hold the entire piece in one hand while applying heat from the soldering iron in the other hand to briefly melt the solder until you can position it correctly. (Sparkfun has a nice tutorial on header installation).

Figure 14. Main component overlay
The last step involves installing a 2-pin female header next to the GND and RAW pins on the Pro Mini. This is where we can connect our power source, i.e., a battery pack.
Important Note: Using the RAW pin on the Pro Mini means any external voltage (from a battery pack for example) will go through the on-board voltage regulator to provide a regulated 3.3V from the VCC pin to all components. The voltage regulator on the Pro Mini (revision 14) draws about 0.1mA of current while the logger is in sleep mode. If you already have a regulated 3.3V power source, you can disconnect the voltage regulator by cutting out the trace as explained previously and connect the battery directly to the GND and VCC pins instead. Any current going through the VCC pin now will not go through the voltage regulator. While not using the on-board voltage regulator on some boards significantly reduces power draw and gives great battery life, using any voltage slightly higher than 3.3V in this particular setup may cause damage and reduce component life. The components may also fail to work; the microSD card reader in particular may corrupt the memory on the microSD card especially if the voltage exceeds its maximum rating, forcing you to manually format the card on the computer. If you are new to low power applications using an Arduino, we recommend supplying a regulated voltage, 3.3V in particular, to all components in order to ensure maximum lifetime of the components, avoid potential failure and data loss. In short – use the RAW pin. There are some Pro Mini clones with a more efficient voltage regulator on board, which may prove very useful here.
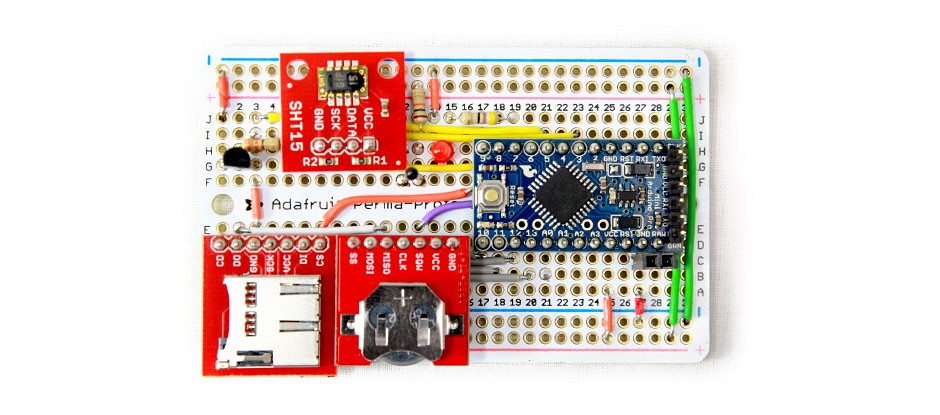
Figure 15. Completed temperature and relative humidity data logger
Once it is soldered, clip off the excess header pins from under the board. Be careful again to wear eye protection while clipping the pins from underneath the board. Repeat this procedure with the microSD, RTC, and SHT temperature and relative humidity breakouts and the thermistor to complete the hardware part of this tutorial.
Ensure the components align properly with the wires. A simple check is to follow the ground pin from the Arduino (GND) and make sure all the components’ GND pin are on the same connection. You can do the same with all other pins on the Arduino.
Now you are ready for the software part of the tutorial.
STEP #3: Setup IDEs and libraries
Before we get to the actual programming, first we need to set up the Arduino IDE (Integrated Development Environment). This is where you will be putting your main program code. Download and install Arduino IDE (make sure it’s v1.0 or higher; we used v1.6.0). It is available for Windows, Mac OS, and Linux.
Next, you will need the DS3234 RTC library and power saving library for the ATmega328. We specifically developed these libraries for our low power dataloggers. You will also need the SHT15 library and the Sdfat library by William Greiman. You can download all the libraries from GitHub.
Installation of these libraries is as simple as extracting all files from the zip file into the “libraries” folder located inside your Arduino IDE installation directory. For example, in Windows, this may be located in C:\Program Files\Arduino 1.0.5\libraries\ or C:\Program Files (x86)\Arduino 1.0.5\libraries. On a Mac, the default directory is user\documents\Arduino\libraries. After extraction, you will have four new folders in your libraries directory: DS3234lib3, PowerSaver, SdFat, and SHT15libmod2.
Note: The library file and folder names should appear exactly as listed above. If the folder name has an extra word such as “-master” at the end, rename it by removing that part.
STEP #4: Programming the datalogger
Now that we have our IDE ready and our libraries installed, let’s program the datalogger. You can get the .ino file and download the entire code from GitHub. Our code is still being tested extensively and we try our best to keep it simple while eliminating bugs. If you have any comments about it, please let us know.
Note: An explanation of how the circuit works is given at the end of the tutorial.
Keep the .ino in the same folder as the file name (e.g., Arduino\osbss_trh_v_0_01\osbss_trh_v_0_01.ino). Open up the .ino file in the Arduino IDE.
Once in the code, we need to do a few things:
1. Manually edit the variables interval, dayStart, hourStart and minStart to your preference. Make sure that the interval is set in seconds only. The other three variables are pretty self-explanatory – enter the day, hour and minute time of when you want the logger to start logging data. The hour should be set in 24-hour clock.
2. Now Edit the variable filename whose value is given in quotations in the code. Make sure that the filename follows the proper format. You can use any combination of letters and digits in your file name as long as it’s less than 8 characters, does not have any spaces and does not start with a number. This is because the SdFat library uses a slightly restriction version of short names for files. Examples would be: filename.csv, log.csv, data_2.txt. Remember that the filename must also have an extension.
3. (Optional) Remember the resistor’s actual value we noted down? We can go in the code and add this value. Scroll down to the line:
float R = resistance(adc, 10000);
Here, you can replace 10,000 with the true value of the resistor. In our case, it was 9,870Ω. If you forgot to measure the actual value of the resistor or don’t have access to a multimeter, you can leave it as 10,000Ω. You don’t need to change anything else in the code.
Now go to Tools > Board and select Arduino Pro or Pro Mini as shown in Figure 16. Make sure the processor’s voltage and clock speed are set to ATmega328 (3.3V, 8MHz).
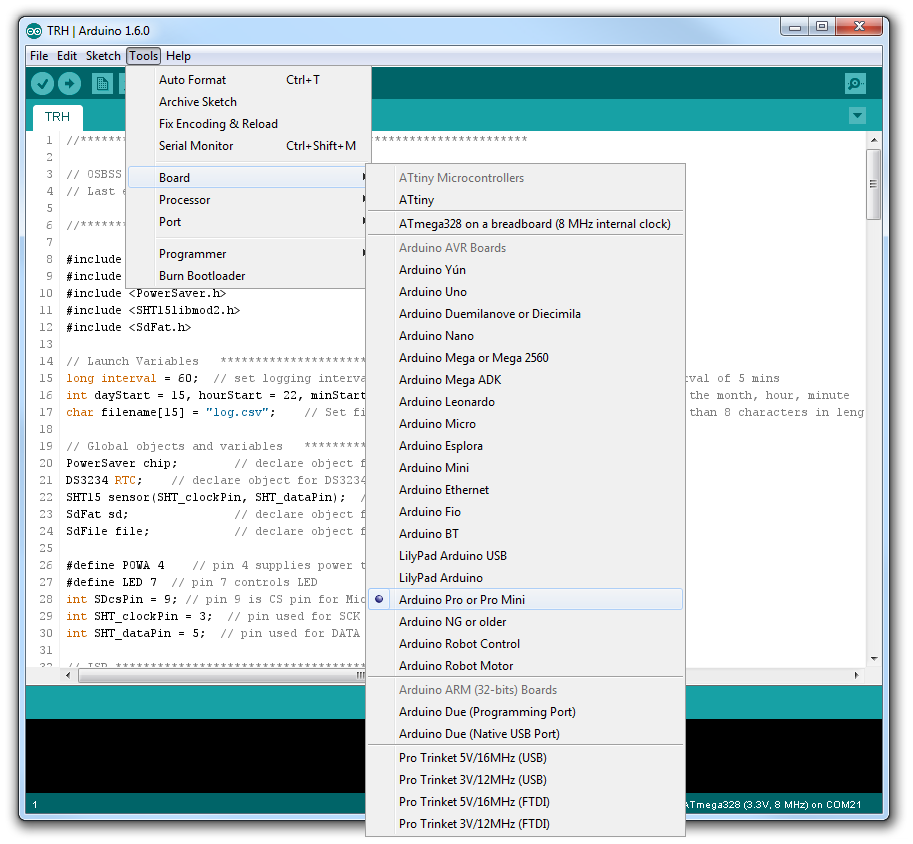
Figure 16. Setting up the Arduino Pro Mini in Arduino IDE
The Arduino Pro Mini uses an FTDI adapter for programming. You will need to download the latest drivers for the FTDI adapter. The FTDI is connected to the PC via a common mini-B USB cable. Connect the FTDI to the Arduino as shown in Figure 17 below.
Note: Some Arduino Pro Mini 3.3V clones in the eBay link provided above have the programming pins reserved. Make sure the pins on the FTDI align with the pins on the Arduino Pro Mini you are using.
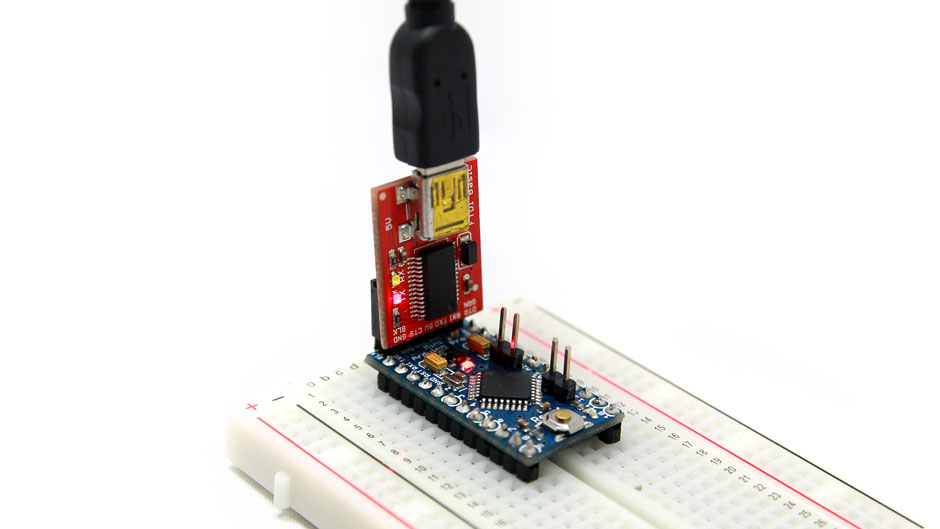
Figure 17. Connecting to the Ardunio Pro Mini via FTDI adapter
Once the FTDI is connected via USB, go to Tools > Serial Port and you will see a new COM port listed (ignore COM 1). This is the FTDI detected by the computer. Select this COM port (on a Mac it will be labeled with a ‘tty’ prefix). Click the Verify button to verify that the code contains no errors. If any errors do pop up, check if you installed the libraries properly. The Arduino IDE needs to be restarted after the installation of the libraries, if it was previously open. If you notice errors in the code, leave a comment and we will try our best to fix it.
Now click the Upload button. You should see “Uploading” at the bottom status bar and the FTDI’s LEDs will start blinking rapidly to indicate data transfer. Once the upload process is complete, you should see the LED on the datalogger blink once. This means the code works fine and data is being written to the SD card. Click on the Serial Monitor button. At the bottom of the new window that pops up, verify that the baud rate is set to 19200.
Once your code is uploaded from the Arduino IDE the Pro Mini retains that information in memory and it won’t need to be re-uploaded unless you need to relaunch the logger at a different time and set a different interval. If the code is significantly updated later, we will post it here and you can re-upload the entire code again (making sure you edit the launch variables).
Note: Mac OS users might have a problem during uploading. If you receive an error such as avrdude: stk500_recv(): programmer is not responding, it is likely an FTDI driver issue. You many need to download the latest Virtual COM Port Drivers from FTDI. Try that and restart the Arduino IDE. If you are still getting a similar error after that, follow the instructions provided in this stackoverflow thread: (1) Go to the Arduino IDE preferences pane and select Verbose output during upload, (2) during the uploading process you will see avrdude send three packets (avrdude: Send: 0 [30] [20]). There’s a trick: if you hit the reset button on your Pro Mini just before these 3 packets are sent the program will likely be uploaded successfully. Hopefully this issue will be resolved in a later version of the Arduino IDE.
Important Note: The DS3234 RTC breakout from SparkFun does not come with its own battery. In addition to buying a battery, you will have to set the current date and time when you use it for the first time. Once it’s set, the RTC maintains the date and time on its coin cell battery for several years, just like any other clock. Check our blog post about configuring the RTC’s date and time. Unless you connect the RTC incorrectly or remove its backup battery, you won’t have to set the date and time again. Be sure to do this first, and then launch the datalogger.
You are now ready to use the temperature and relative humidity datalogger!
STEP #5: Test Run
Now you can take the FTDI cable off and connect your battery. The positive (red) end of the battery pack should go into the RAW pin on the Arduino, while the negative (black) end goes into the GND pin. Be VERY CAREFUL not to get this wrong or you can easily damage the components! You can either use a 3 AA battery pack, Lithium Ion Polymer battery or any other power source you want.
Timestamped temperature and relative humidity data will be recorded at the interval you selected for as long as the logger has power. To retrieve data, simply eject the microSD card and place into a microSD adapter and read directly from your computer as if it you were downloading photos from a digital camera. You’ll see your .csv file with all logged data up until the point that you removed the microSD card or the logger lost power (whichever comes first). One thing is for sure – you probably will never ever run out of memory while writing data. During our tests, one of our loggers was logging data at 1-minute intervals for about 3 months (over 100,000 measurements) and the filesize was around 4.86MB only. At this rate, it would take about 415 years to completely fill up a typical 8GB microSD card.
As an indication, when the microSD card is out, the datalogger blinks the LED three times at every time interval to indicate a missing card. Data will not be logged during the time the SD card is out of the datalogger and logging will resume once you insert it back in. Alternatively, you can relaunch the logger with different launch parameters.
Understanding how the circuit works:
Now that the circuit is ready and you have successfully launched your logger, we can take a look at the layout and begin to understand how it all works. The Arduino is the main microprocessor to which every other component is connected. If you noticed while wiring, the microSD card breakout and the RTC have some pins in common, namely, MOSI (or DI), MISO (or DO) and CLK (or SCK). These three pins are shared by all SPI devices. in a circuit. They connect to pin 11, 12 and 13 on the Arduino respectively. Each SPI device has a unique SS (or CS) pin on the Arduino through which it can be identified, and the microSD card breakout’s and RTC’s are pin 9 and 10 respectively. To learn more about Serial Peripheral Interface (SPI) and how it works between devices, check out a nice guide by SparkFun.
The SHT15 is an accurate relative humidity sensor from Sensirion. It uses a 2-wire serial interface for communication and provides a 14-bit digital output which is converted into actual RH reading. Pins 3 and 5 on our datalogger are used for communicating with the SHT15. The GND pin on the sensor’s breakout board is connected to the transistor’s collector pin, so we can power the sensor off while it’s not taking any measurement.
The thermistor is a simple analog component. Common thermistors like the one we’re using have a negative temperature coefficient. This means that as temperature increases, their resistance decreases and vice versa. This change in resistance can be easily measured if we convert it into a voltage reading. The Arduino Pro Mini is based on Atmel’s Atmega328P processor, which has a 10-bit ADC (Analog to Digital Converter) that can read a range of voltage input. The pins A0 to A7 on the Pro Mini are all analog input pins that can read voltage outputs from various sensors. The two wires that go under the board connect the thermistor in the circuit. The green wire connects the thermistor to Arduino’s A0 pin to read its value and the white wire connects the other lead of the thermistor to the transistor’s collector pin, so we can power the thermistor off while it’s not taking any measurement.
The transistor is used to turn off the microSD card, the thermistor and the SHT15 when not in use. Any component connected to the Arduino’s pins can consume some power, even when they’re not taking measurements. While microSD cards are becoming very efficient in standby mode these days, they need proper pin configuration to avoid unnecessary power draw when not in use. For extended logging applications, the standby current consumption can also been seen as significant. MicroSD cards also consume a large amount of power during initializing, reading and writing, from 50mA up to 150mA in some cases. Using a transistor helps in supplying a large amount of current when needed, and turning it off when not required. Arduino’s pins can supply around 30-40mA only, while the total power supplied to all devices by the Pro Mini’s (Rev. 14) voltage regulator is around 200mA. If 150mA out of this is consumed by the microSD card every time we wake it up, then we might be reaching our threshold of maximum current consumed by the circuit and other components might fail, especially if we happen to add more sensors or devices in this footprint. A transistor can overcome this issue and supply a large amount of current when needed. We simply connect the GND pins of the components we want to turn off to the collector lead of the transistor, instead of the actual GND in the circuit. The Transistor’s emitter pin is then connected to the actual GND pin. The transistor basically acts like a switch, but can also allow devices to pull large amounts of current from the power source. To read more about how transistors work and what else you can do with them, check out SparkFun’s tutorial.
The DS3234 RTC keeps the time for our datalogger. Our specially made library for the dataloggers allow reading of time as well as generating an interrupt. The RTC has alarm functions which allow it to generate a square wave at any specific interval or at any given time. More information about how they actually work is given in the RTC’s datasheet. We set up the code in such a way that it detects what interval you specified (in seconds), and then converts it to an actual time in the future to generate an alarm in the form of a square wave. Once the Arduino is in deep sleep mode, some event like a button press, interrupts on a pin or an internal timer can wake it up. If none of these are set up, the Arduino is permanently in sleep mode and never wakes up. The RTC’s SQW pin is connected to Pro Mini’s pin 8 and we set up the code to detect a pin change interrupt on this pin. Let’s say you define the logging interval as 60 seconds. When the Arduino goes to sleep, the RTC sets an alarm for 1-minute in the future and the moment the current time and the alarm time is matched, it generates a square wave on pin 8, which is detected as an interrupt by the Arduino and it wakes up to take measurements and save data. All of this is done almost instantaneously.
The LED gives a visual indication of when data has been written to the card. LEDs can consume a high amount of current, so we want to make sure to limit the current going to the LED by using a resistor in series with it. The LED in our datalogger is connected with a resistor to pin 7, which is turned on and off in code. The LED is turned on for about 10 milliseconds once data is written to the SD card and then turn it off instantly.
Summary
Figure 18. Assembled OSBSS temperature and relative humidity logger
With the above setup, we can now achieve an idle current draw of around 0.195mA, raising up to several milliamps for a very short duration when the chip wakes up, takes temperature and relative humidity measurements and writes data to the SD card and then goes back to sleep. All of this happens within about 0.05 seconds, before the chip is in power-down sleep mode again. We are using alarm features in the DS3234 RTC, which generate an interrupt using the SQW (Square Wave) pin. The Arduino only wakes up when it detects this interrupt, which happens every time your logging interval is matched.
By using this low power approach, we can get a theoretical lifetime of 8-12 months on 3 AA batteries (assuming logging interval of 1 minute). Alternatively, you can also use one 3.7V 4,400mAh Li-Po battery from Adafruit ($19.95) to get almost two years of battery life. If you are feeling adventurous, you can aim for ultimate power-savings by using the bare ATmega328P chip itself. With no additional peripherals, it can significantly reduce current draw even further, increasing the battery life up to 4-5 years in some cases; but beyond that point, the self-discharge rate of the battery would limit the total time the logger can have power.
You can now put this setup in an enclosure for protection and to improve aesthetics.
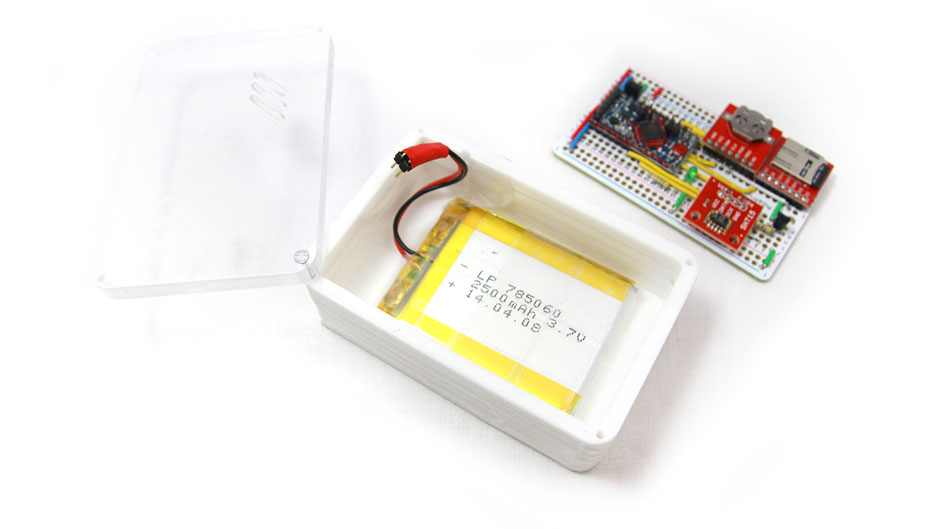
Figure 18. Lithium ion battery in an acrylic enclosure
We placed a Li-Po battery in a laser cut acrylic box and placed the datalogger on top of it. We also provided some openings on the top for the sensor to measure the air temperature and relative humidity.
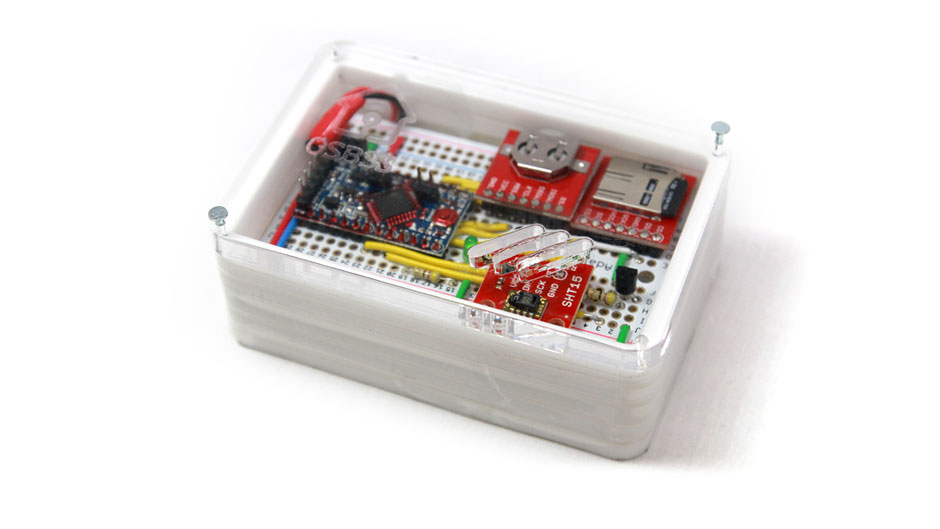
Figure 19. Completed and powered data logger installed in custom acrylic enclosure
Note that while using an enclosure provides protection, it may also increase response time of the datalogger, as air inside the box can take a while to change relative to the air outside it. It may also skew the readings to an extent, depending on the environment. We are still working on other types of enclosures that have lower thermal mass and are easier to prototype. If you have ideas please send them our way!
If you already have a lot of experience in soldering and developing your own PCBs, you can save some money by buying the SMD parts in bulk instead of the breakout boards. Soldering SMD components is a very delicate process – any wrong move in the circuit design or soldering, and your entire PCB is toast. Only try it if you know exactly what you’re doing.
To see an example of data collected from one of these custom data loggers, check out Prof. Stephens’ post on his first temperature and relative humidity version 0.01 build and his follow-up post on the latest revision of our datalogger.